Crafting a Paid Social Playbook for Series A SaaS Success
A six-component paid social playbook for Series A SaaS teams, with the 70/20/10 budget framework, metrics that hold up at board level, and a 90-day rollout for moving from director-in-the-head execution to documented, repeatable process.

Three months in. Paid social campaigns are working. MQLs come in. Pipeline shows up.
Then the CEO asks for the Q3 plan. You can’t write it down crisply. The decisions are in your head: audience choices, budget shifts, creative refresh cadence, all judgment calls made on the fly. There is no playbook. There is only you.
This is the failure mode of paid social at Series A. The campaigns aren’t wrong. The execution isn’t bad. But the programme can’t be handed to anyone else, can’t be predicted forward, can’t be defended in a monthly budget review without rebuilding the rationale from scratch every time. The fix is turning a paid social strategy for Series A SaaS into a documented playbook, then running it with the discipline a Series B team takes for granted.
This article walks through what a Series A paid social playbook actually contains, how to build one in 90 days, and how to avoid the patterns that turn playbooks into shelfware.
Why Series A Paid Social Programmes Don’t Scale Without a Playbook
Three problems show up the moment a Series A team tries to grow paid social beyond its initial traction.
The first is the director-as-bottleneck pattern. One person holds the campaign logic in their head. Every decision routes through them. The programme can’t run without them. When they go on leave, the campaigns drift. When they leave the company, the programme starts from zero. This is fine at seed stage. It’s a structural risk at Series A and a serious one by Series B.
The second is forecast unreliability. Without a playbook, next quarter’s plan is a fresh exercise every time. The director re-decides budget splits, channel mixes, and audience priorities each quarter, often based on whichever campaign happened to perform last month. Pipeline forecasts swing wildly because the inputs swing wildly. Investors and the CEO stop trusting the numbers.
The third is budget defence in monthly reviews. When the CFO asks why £45,000 went to LinkedIn last month, the answer needs to be a rule that was set in advance, not a story constructed after the fact. Without a playbook, every budget conversation is reactive. With one, the rules are pre-agreed and the conversation is about whether the rules are still right.
The cost of not having a playbook is rarely visible at Series A. The cost shows up later: scaling stalls, the director burns out, or the next hire takes six months to ramp because there’s no documentation to learn from.
What a Paid Social Playbook Actually Contains
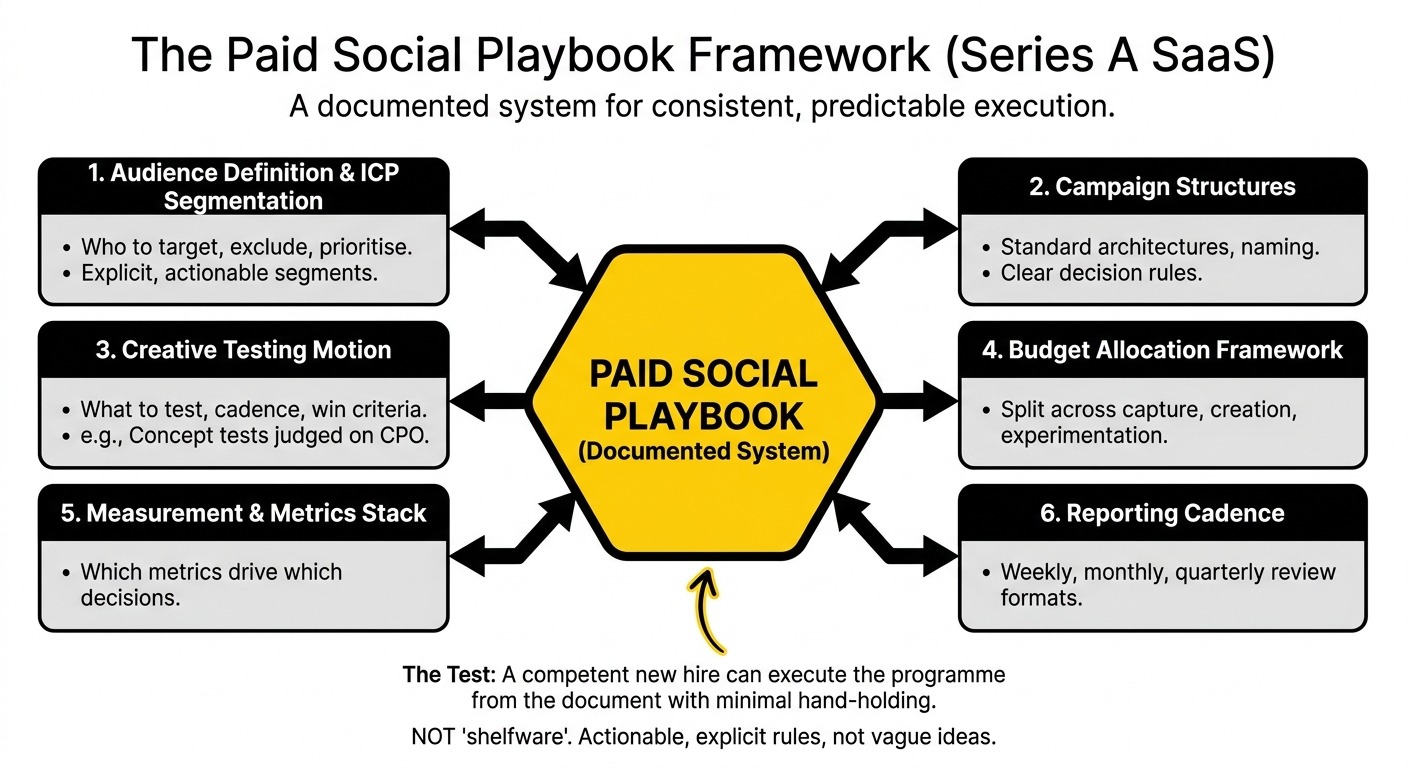
A paid social playbook for a Series A SaaS team is a documented set of decision rules, campaign structures, budget allocations, audience definitions, and reporting cadences that allow the programme to be executed consistently and predictably regardless of who runs it. The test of a real playbook is simple: a competent new hire can execute the programme from the document with minimal hand-holding. Anything less is shelfware.
A working playbook has six components.
- Audience definition and ICP segmentation: who you target, who you exclude, and how segments are prioritised
- Campaign structures: the standard architectures, naming conventions, and decision rules
- Creative testing motion: what gets tested, at what cadence, and what wins
- Budget allocation framework: how money is split across capture, creation, and experimentation
- Measurement and metrics stack: which metrics drive which decisions
- Reporting cadence: weekly, monthly, and quarterly review formats
Each of these needs to be explicit enough that someone reading the document can act on it. “We test creative monthly” is not enough. “We run one concept-level test per major campaign per month, with a minimum 14-day window, judged on cost per qualified opportunity” is.
The next sections walk through each component with the level of specificity that Series A teams actually need to operate from.
The Six Components of a Series A Paid Social Playbook
Component 1: Audience definition and ICP segmentation
Document the primary ICP at firmographic and role level. For a Series A SaaS analytics platform, that might be Series B to Series C SaaS companies in the UK and US, 50 to 500 employees, with marketing operations or revenue operations roles as primary buyer and finance leadership as secondary buyer. Be specific. Vague ICPs produce vague targeting.
Document at least one secondary segment for testing or expansion, with a named hypothesis for why it might work. If the playbook says “we’ll test US enterprise once we’ve proven Series B SaaS UK”, that’s a real expansion plan. “We’ll figure out enterprise later” is not.
Document exclusions. Competitors, current customers, low-fit segments. Exclusion logic prevents budget waste and keeps audience hygiene tight.
Document account lists for any ABM motion, with a clear cadence for when they’re refreshed (typically quarterly).
Audiences get reviewed quarterly. Not weekly. Audience volatility is a leading indicator of an unstable playbook.
Component 2: Campaign structures and decision rules
Pick the platforms and write down the role each plays. A common Series A B2B SaaS structure looks like this: LinkedIn for sponsored content and conversation ads against the primary ICP, Meta for retargeting and lookalike expansion, Google Ads for high-intent demand capture. Other platforms are tested as exceptions, not defaults.
For each platform, document:
- Campaign types in use (sponsored content, conversation ads, retargeting, etc.)
- Bid strategy defaults
- Always-on campaigns vs scheduled launches
- Naming conventions (rigid, machine-readable, used everywhere)
- The budget allocated and the reasoning
Naming conventions are the part most teams skip and regret later. A standard like Platform_Audience_Format_Concept_DateLaunched produces a programme that’s auditable from a CSV export. Without it, every report is a manual reconstruction.
Component 3: Creative testing motion
Series A teams rarely have the volume to support sophisticated A/B testing, so the playbook needs to be honest about what testing can produce at this stage. Concept-level tests beat micro-tests every time. Two to three variants per test, 14 to 28 days, judged on cost per qualified opportunity.
We’ve covered the full creative testing approach in Creative Testing Frameworks for B2B SaaS Paid Social, including the four-layer framework (concept, format, offer, audience-creative fit) that holds up at low volumes. The Series A version is the same framework, run at lower frequency: one concept test per month per major campaign, format testing once a quarter.
The playbook should specify the test backlog format (hypothesis, variants, audience, success metric) and where results get documented. Without documented results, the testing programme produces no compounding learning.
Component 4: Budget allocation framework
Default allocation: 70% to demand capture and conversion, 20% to demand creation and education, 10% to experimentation. The ratios shift based on company stage and product complexity, but the framework holds.
Demand capture (70%) funds high-intent campaigns: branded search, retargeting, conversion-focused LinkedIn campaigns to ICP segments showing buying signals. This is the budget that produces near-term pipeline.
Demand creation (20%) funds upper-funnel education: thought leadership content, founder-voice posts, broader awareness campaigns. This budget rarely produces immediate pipeline. It builds the audience that converts later.
Experimentation (10%) funds new audience tests, new format tests, and new platform tests. The 10% is non-negotiable. Programmes that don’t reserve experimentation budget stop learning, which means they stop improving.
The mistake most Series A teams make is putting 95% into capture because that’s where the attributable pipeline shows up fastest. Six to nine months later, the team realises growth has plateaued because no one was building the audience that capture was meant to harvest. The 70/20/10 split is a discipline against that drift.
Component 5: Measurement and metrics stack
Document which metrics drive which decisions, in three layers.
Leading indicators (weekly review): CTR, CPM, cost per click, cost per lead, cost per registration. Use these to manage week-to-week campaign performance.
Intermediate metrics (monthly review): MQL rate, SQL conversion rate, opportunity creation rate, pipeline contribution by channel and campaign. Use these to decide where budget should shift next month.
Lagging indicators (quarterly review): cost per qualified opportunity, pipeline created per pound spent, closed-won revenue by acquisition cohort, CAC payback period. Use these for board reporting and budget defence.
The playbook should specify which metric overrules which. A campaign with strong CTR but high cost per opportunity gets killed. A campaign with weak CTR but strong opportunity creation gets protected. Default rules prevent emotional reactions to weekly noise.
Component 6: Reporting cadence
Three reports, three cadences, three audiences.
Weekly (internal): a 30-minute review of leading indicators, with one decision recorded. Usually a budget shift, a creative refresh, or a campaign pause.
Monthly (leadership): a 45-minute review of intermediate metrics, with a one-page written summary covering pipeline contribution, what worked, what didn’t, and what’s planned next month.
Quarterly (board): a presentation framed in commercial metrics: cost per opportunity, pipeline contribution, CAC payback. The board doesn’t want the campaign-level detail. They want to know if marketing spend is buying revenue at a defensible rate.
Templated reports save hours per cycle and force consistency in how the programme is described over time.
Balancing Immediate Pipeline With Long-Term Brand Education
The most common failure mode at Series A is over-indexing on demand capture. The pipeline pressure is real. The board wants growth. Capture campaigns produce attributable pipeline within weeks, while creation and education campaigns produce results over months. Default behaviour is to fund what’s measurable now and starve what isn’t.
Six to twelve months later, the bill comes due. Capture campaigns harvest demand that someone else has to create. If no one has been creating it, the addressable pool stops growing, capture campaigns get more expensive as competition intensifies, and the team finds itself unable to scale spend without watching cost per opportunity climb.
The 70/20/10 split (capture, creation, experimentation) prevents this. The exact ratios shift based on company stage. Pre-product-market-fit teams skew further toward experimentation. Post-PMF Series B teams often shift to 60/30/10 or even 50/40/10 as they scale awareness investment. But the principle holds at every stage: protect the budget for the work that compounds over time.
For Series A specifically, treat the 20% creation budget as ICP audience development. Founder-voice content, thought leadership distributed via LinkedIn Sponsored Content, podcast partnerships, and webinar programmes all qualify. The job is to build the audience that capture can convert in three to six months, not to drive immediate signups.
Budget Allocation for Lean Teams: How to Stretch a Series A Budget
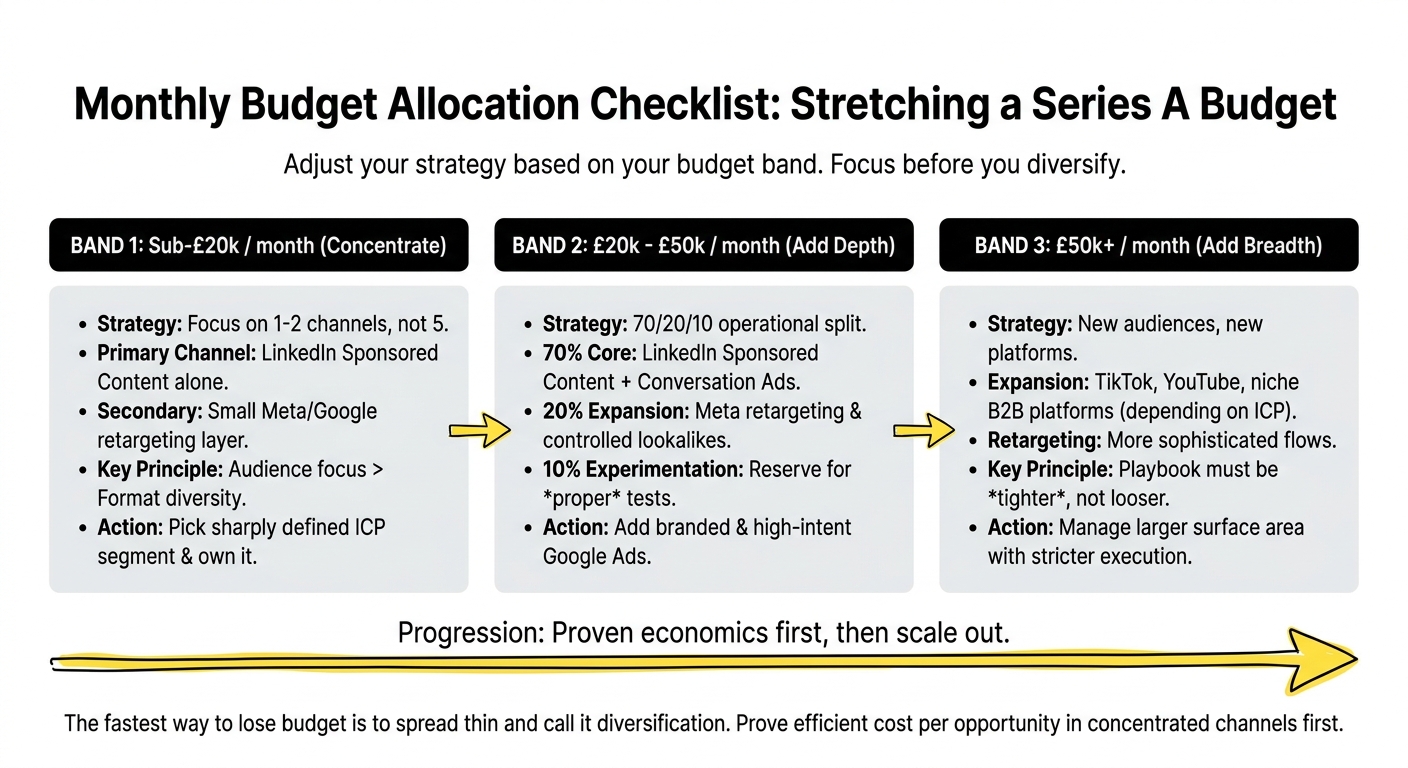
Three budget bands cover most Series A SaaS programmes. Adjust the allocation logic to the band you’re in.
Sub-£20k per month: Concentrate. Run one or two channels, not five. LinkedIn Sponsored Content alone, with a small retargeting layer on Meta or Google, beats a thinly-spread programme across four platforms. At this budget, format diversity matters less than audience focus. Pick the sharpest ICP segment and own it.
£20k to £50k per month: Add depth. LinkedIn Sponsored Content plus conversation ads, Meta retargeting and a controlled lookalike expansion, Google Ads for branded and high-intent terms. This is the band where the 70/20/10 split becomes operational. Reserve the 10% experimentation budget for proper tests.
£50k+ per month: Add breadth. New audience segments, new platforms (TikTok, YouTube, niche B2B platforms depending on the ICP), more sophisticated retargeting flows. At this level, the playbook needs to be tighter, not looser, because the surface area is larger and the cost of execution drift is higher.
The fastest way to lose budget is to spread thin and call it diversification. The fastest way to grow it is to demonstrate efficient cost per opportunity in one or two concentrated channels first, then scale out from a position of proven economics.
The Metrics That Matter at Series A
Series A reporting often inherits the metrics framework from earlier-stage decks: signups, click-through rates, cost per lead. These metrics aren’t wrong, but they don’t survive board scrutiny once growth becomes the headline.
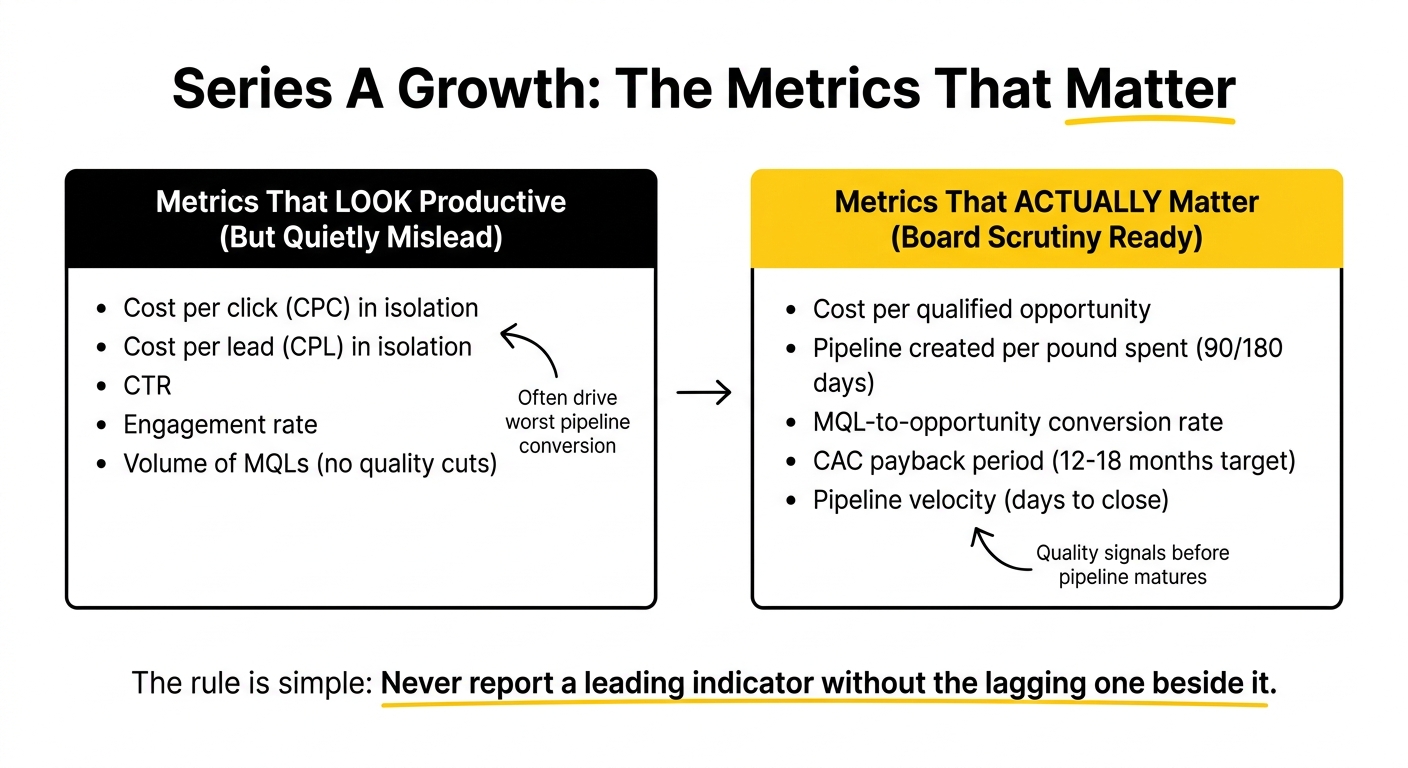
The metrics that actually matter for paid social at Series A:
- Cost per qualified opportunity: total programme spend divided by sales-accepted opportunities. The standard cross-channel comparison metric.
- Pipeline created per pound spent: total pipeline contribution divided by paid social spend, measured at 90 and 180 days.
- MQL-to-opportunity conversion rate, by source: a quality signal that flags weak audience targeting before pipeline data matures.
- CAC payback period: how many months until the customer pays back acquisition cost. Series A targets typically 12 to 18 months for B2B SaaS.
- Pipeline velocity: average days from first paid touch to opportunity creation, then to closed-won.
The metrics that look productive but quietly mislead at Series A:
- Cost per click and cost per lead in isolation
- CTR
- Engagement rate
- Volume of MQLs without quality cuts
A campaign with the lowest cost per lead in the programme is often the one driving the worst pipeline conversion. The rule is simple: never report a leading indicator without the lagging one beside it.
Common Pitfalls When Building a Paid Social Playbook at Series A
Five pitfalls show up repeatedly when Series A teams build their first playbook.
Treating LinkedIn like Meta. They aren’t the same. LinkedIn produces 5x to 10x higher CPMs because the audience targeting is precision B2B. A programme that runs LinkedIn at Meta-style budgets produces almost nothing usable. Either fund LinkedIn properly or skip it.
All-in on demand capture. Easy at Series A, costly at Series B when capture saturates. Reserve the 20% creation budget from day one.
Building the playbook in a Google Doc no one updates. A playbook that hasn’t been updated in two quarters isn’t a playbook. Set a quarterly review cadence and treat it like a calendar commitment.
No reserved experimentation budget. Programmes that don’t run experiments stop learning. Programmes that stop learning stop improving. The 10% experimentation reserve is the smallest defensible amount.
Reporting on impressions and CTR to leadership. It signals that the programme is judging itself by activity rather than outcomes. Rebuild the reports around pipeline metrics before the next monthly review.
A 90-Day Rollout for Building Your First Paid Social Playbook
For a Series A team building a playbook from scratch, this is the rollout that produces a usable document with proven economics within one quarter.
Days 1 to 30: Document what’s currently happening.
- Audit the current campaigns, audiences, creatives, and metrics
- Document the ICP at firmographic and role level
- Set up naming conventions and apply them retroactively to active campaigns
- Define the 70/20/10 budget split for next month
- Build the metrics stack and the three reports (weekly, monthly, quarterly)
Days 31 to 60: Run from the playbook.
- Launch campaigns from the documented structures
- Run the weekly and monthly review cycles for the first time
- Document what doesn’t work in the playbook (the gaps, the missing decisions)
- Run the first concept-level creative test
- Pull the first 30-day pipeline read
Days 61 to 90: Refine and prove repeatability.
- Update the playbook with what you learned in the first 60 days
- Run the second creative test cycle
- Hand a section of the playbook to someone else (a contractor, a junior, an agency) and see if they can execute from it
- Pull the 90-day cohort data to defend the next quarter’s budget
The goal at the end of 90 days isn’t a polished document. It’s a working version that produced one full quarter of data, with documented decisions you can defend in a board meeting. Polish comes later. Repeatability comes first.
How Upraw Approaches Paid Social Playbook Development
Two patterns hold across the Series A SaaS clients we run paid social for.
The first is that the documentation matters more than the strategy. We’ve audited dozens of Series A programmes where the strategy was sound but the execution drifted because nothing was written down. The teams that scale successfully are the ones where the playbook is treated as a living document, reviewed quarterly, and used as the source of truth for every campaign decision.
The second is that the 70/20/10 budget split holds across most Series A SaaS contexts, with one common adjustment: teams with longer sales cycles (six months or more) often shift toward 60/30/10, with more weight on creation. The shorter the sales cycle, the more aggressive the capture allocation can safely be.
For more on getting the creative testing motion right inside a playbook, our piece on Creative Testing Frameworks for B2B SaaS Paid Social goes into the full four-layer framework. The playbook in this article assumes you’ll use that one as the testing component.
If you’re building a paid social playbook at Series A and the document keeps falling out of sync with what’s actually running, the issue is usually the cadence, not the content. Most of the work we do as a b2b saas marketing agency uk starts with helping teams build the review rhythm before refining the strategy itself. If that’s where you are, we’re happy to take a look. Companion pieces on this blog, How to Build a SaaS PPC Engine for B2B SaaS and Unlocking LinkedIn Paid Social: A B2B SaaS Strategy Blueprint, take the related angles further.
Frequently Asked Questions
What are the key components of a Paid Social Playbook for Series A SaaS teams?
Six components: audience definition and ICP segmentation, campaign structures and decision rules, creative testing motion, budget allocation framework (typically 70/20/10 across capture, creation, and experimentation), measurement and metrics stack, and reporting cadence. Each component needs to be specific enough that a competent new hire can execute the programme from the document. The test of a real playbook is whether it can be handed off without the original author needing to translate.
How can Series A SaaS companies balance immediate pipeline performance with long-term brand education in their paid social strategies?
Use a 70/20/10 budget split: 70% to demand capture and conversion, 20% to demand creation and education, 10% to experimentation. The capture budget produces near-term pipeline. The creation budget builds the audience that capture converts in three to six months. The experimentation budget keeps the programme learning. The discipline is protecting the 20% creation allocation when pipeline pressure is high, since starving creation is the most common cause of growth plateaus six months later.
What metrics should Series A SaaS marketing directors focus on to measure the success of their paid social campaigns?
Cost per qualified opportunity, pipeline created per pound spent, MQL-to-opportunity conversion rate by source, CAC payback period, and pipeline velocity. These hold up in board reporting because they connect spend to revenue. Leading indicators (CTR, CPM, cost per lead) are useful for week-to-week campaign management but should never be reported to leadership in isolation. Always pair a leading indicator with the lagging one it’s meant to predict.
What are some actionable templates for creating repeatable campaign structures in paid social for SaaS?
The minimum templates: a campaign naming convention (Platform_Audience_Format_Concept_DateLaunched), a test brief template (hypothesis, variants, audience, budget, duration, success metric), a weekly review template, a monthly review one-pager, and a quarterly board report. Each platform also needs a standard campaign architecture: campaign types in use, bid strategy defaults, budget split logic. The templates should sit in one document or shared workspace, not scattered across drives.
How can lean marketing teams optimise their paid social efforts on a limited budget?
Concentrate before diversifying. Run one or two channels deeply rather than five thinly. Pick the sharpest ICP segment and own it. Reserve 10% of budget for experimentation no matter how lean the programme is, because the alternative is a programme that doesn’t learn. Document everything from day one, even when the team is one person, since the playbook is more valuable when the team grows than it feels in the moment.
What common pitfalls should Series A SaaS teams avoid when building their Paid Social Playbook?
Treating LinkedIn like Meta (different CPMs require different funding logic), going all-in on demand capture and starving creation, building the playbook in a doc no one updates, leaving experimentation budget unreserved, and reporting impressions or CTR to leadership instead of pipeline metrics. The structural mistake behind most of these is treating the playbook as a one-time exercise rather than a quarterly discipline.
How can data-driven strategies improve the effectiveness of paid social campaigns for SaaS companies?
Data-driven decision making in paid social means tying every recurring decision to a specific metric and a specific threshold, documented in advance. Budget reallocation decisions tie to cost per qualified opportunity. Creative refresh decisions tie to CTR decay and frequency caps. Audience expansion decisions tie to MQL-to-opportunity conversion rates. The improvement comes from removing emotional or political reasoning from the decision loop, not from the volume of data being analysed.
What role does audience targeting play in the success of paid social campaigns for SaaS?
It’s the single biggest variable. A precise ICP definition with role-level targeting, paired with strong exclusion logic, produces 2x to 5x better cost per opportunity than broad targeting on the same creative. For B2B SaaS, LinkedIn’s role and seniority targeting plus account list uploads are the strongest available levers. Document the primary ICP, at least one secondary segment, and an exclusion list explicitly. Vague audiences produce vague results.
How can Series A SaaS teams demonstrate clear ROI from their paid social efforts to leadership and investors?
Reframe the conversation in commercial metrics. Cost per qualified opportunity sits next to other channels in apples-to-apples comparisons. Pipeline created per pound spent translates spend to revenue language. CAC payback period speaks to investors directly. “We generated £2.4M of pipeline at £540 per opportunity with a 14-month payback period” is a defensible budget argument. “We had 3,200 MQLs this quarter” is not. Run the programme for at least 90 days before requesting budget increases so the cohort data has matured.
What are some best practices for testing and iterating on paid social campaigns in a SaaS context?
Test concepts before you test micro-elements (headlines, button colours). Run two to three variants per test, not six. Allow 14 to 28 days for tests to mature at typical Series A volumes. Judge on cost per qualified opportunity, not CTR. Document hypotheses before launching tests and document results regardless of outcome. The full framework for creative testing at low volumes, including the four-layer approach to concept, format, offer, and audience-creative fit, sits in our Creative Testing Frameworks for B2B SaaS Paid Social article.