Transforming Webinars into Revenue: A Playbook for SaaS Marketing Leaders
A playbook for Series B+ SaaS marketing leaders on turning webinar programmes into measurable pipeline, with attribution that holds up at board level and a 90-day rollout for restructuring the programme.

The board asks where Q3’s pipeline came from. You point to the webinar series: six events, 2,400 registrants, 1,100 attendees, strong post-event NPS. The CFO asks for the revenue figure. You don’t have a clean number. Last-touch attribution credits the SDR follow-up. First-touch credits whichever ad introduced the prospect months earlier. The webinars sit in the middle of every closed-won deal but get credit for none of them.
This is the standard pattern for webinar marketing strategies for revenue in B2B SaaS. Webinars work, the engagement data is strong, but the connection to pipeline is always one report away from being defensible.
The fix isn’t a better webinar. It’s a different way of structuring the programme so that paid social acquisition, webinar engagement, and post-event handoff are designed as a single revenue motion, with attribution that holds up at the board level. This article lays out how that programme is built, the metrics that defend it, and the budget framing that survives a CFO’s scrutiny.
Why Webinars Stall in the Pipeline (Even When the Numbers Look Good)
Three reasons webinar programmes underperform commercially even when the engagement metrics are strong.
The first is measurement that stops at attendance. Most webinar reporting tracks registrations, attendance rate, completion rate, and engagement scores. None of those tie to revenue. A webinar with 2,000 registrations, 700 attendees, and zero pipeline generated is a successful webinar by these metrics. It’s a failed programme by any commercial measure.
The second is attribution models that don’t see webinars. Last-touch attribution credits the SDR call. First-touch credits the introductory ad from months earlier. Multi-touch models that don’t include webinar engagement as a weighted touchpoint give the programme zero credit for influence it actually exerts. The CFO concludes webinars don’t generate revenue. The data isn’t wrong, the model is.
The third is disconnected execution. The paid social team buys registrations. The events team runs the webinar. The sales team gets a list a week later. Each team optimises for their own metrics. Cost per registration drops, attendance rate climbs, sales follows up the leads, and the programme produces no compounding pipeline because no one is accountable for the journey from click to closed-won.
Fix all three and the programme starts to drive revenue you can defend in a board meeting. Fix one or two and you’ll be back to “we believe webinars contribute”.
The Webinar-to-Pipeline Framework: Five Stages That Move the Needle
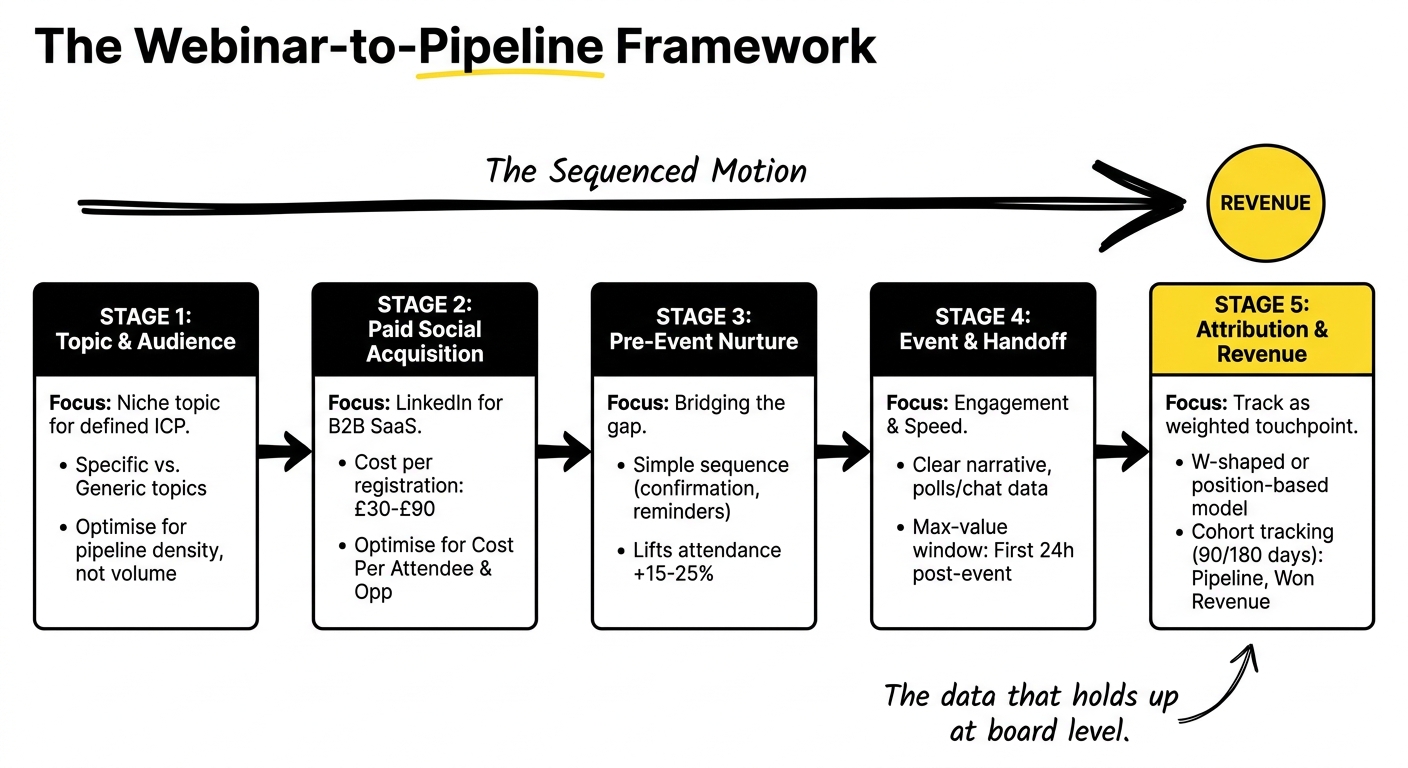
Webinars produce measurable revenue when the programme is built as a sequenced motion across five stages, each with its own KPIs and handoffs.
Stage 1: Topic and audience definition
The biggest variable in webinar performance is whether the topic aligns with the priority pain of a clearly defined ICP segment. Generic topics (“How to grow your SaaS in 2026”) attract registrations but produce low pipeline contribution because they don’t filter for buying intent. Specific topics (“How RevOps teams at Series B SaaS are restructuring measurement post-GA4”) attract fewer registrations but a much higher proportion of in-market buyers.
The trade-off is volume versus pipeline density. For Series B+ programmes, pipeline density wins. Run niche topics for tightly defined segments rather than broad topics for everyone.
Stage 2: Paid social acquisition
LinkedIn Sponsored Content combined with conversation ads is the dominant format for B2B SaaS webinar acquisition. Cost per registration sits in the £30 to £90 range for sharply defined ICP audiences, depending on seniority and competitive density. Cost per click in this context typically lands between £8 and £20. Cost Per Acquisition (CPA) - The Most Critical PPC Metric, also on this blog, takes this further.
Don’t optimise the ad campaign for cost per registration alone. Optimise for cost per attendee, then for cost per qualified opportunity downstream. The cheapest registrations rarely produce the best pipeline.
Stage 3: Pre-event nurture
The gap between registration and event is where most programmes lose value. Registrations sit cold for 7 to 14 days before the event. Attendance rates collapse without nurture. A simple sequence (confirmation, calendar invite, agenda preview, speaker introduction, day-of reminder) lifts attendance by 15 to 25 percentage points compared to no-nurture programmes.
Pre-event nurture is also a qualification opportunity. The interactions in this period (which content opened, which links clicked) feed scoring and segmentation for the post-event handoff.
Stage 4: The event and post-event handoff
The webinar itself is one variable in a many-variable programme. Don’t over-invest in production. Invest in the structure: clear narrative, specific takeaways, mid-event polls or chat that produce engagement data sales can use.
Post-event handoff is where most programmes drop the ball. Sales receives a list 24 to 48 hours later. By then, intent has cooled. The maximum-value window is the first 24 hours post-event for attendees who showed strong engagement signals (high chat activity, late-event drop-off, asked questions). Sales follow-up needs to happen in that window with context: what segment, what topic, what they engaged with. Not a generic “thanks for attending” email.
Stage 5: Attribution and revenue measurement
Track the webinar as a weighted touchpoint in a multi-touch attribution model. The W-shaped or position-based model is the practical choice. Give credit at first touch, lead creation, and opportunity creation, with the webinar typically falling in one of those positions.
Run cohort-level revenue measurement. For each webinar, track the cohort of attendees through 90 and 180 day windows: pipeline created, opportunities created, closed-won revenue, average deal size. This is the data that holds up at board level because it’s directly tied to revenue, not engagement proxies.
Multi-Touch Attribution for Webinar Campaigns
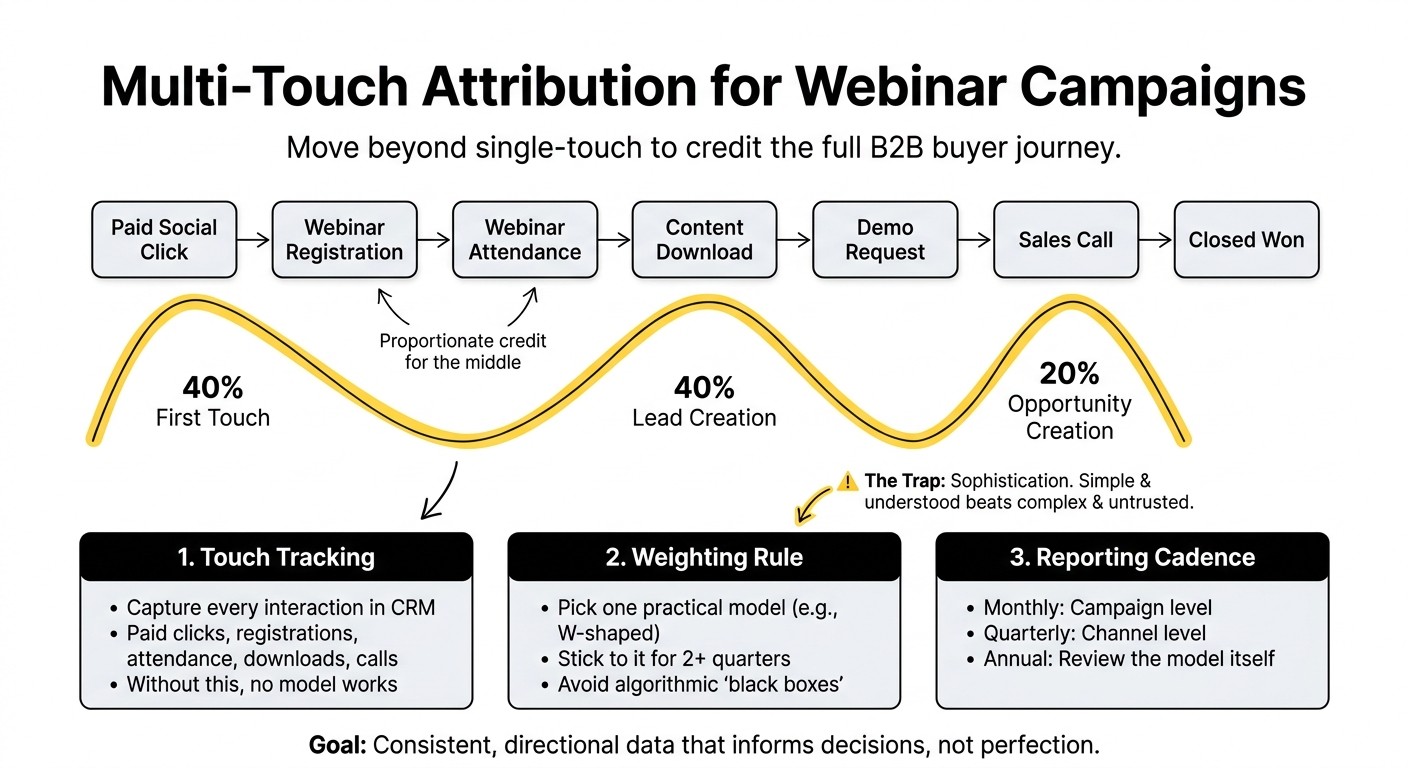
Multi touch attribution marketing is the discipline of assigning credit across multiple interactions in the buyer journey rather than crediting only the first or last touch. For B2B SaaS with long sales cycles and webinar-heavy programmes, single-touch attribution is wrong by design.
The minimum viable model has three components.
Touch tracking across channels. Every paid social click, webinar registration, webinar attendance, content download, demo request, and sales call needs to be captured against the contact in your CRM. Without this, no attribution model will work, regardless of sophistication.
A weighting rule. The most common practical models are W-shaped (40% first touch, 40% lead creation, 20% opportunity creation, distributed across other touches) and position-based (40% first, 40% last, 20% middle). Pick one, stick to it for at least two quarters, and judge results against it.
A reporting cadence that connects spend to outcomes. Monthly attribution reporting at the campaign level. Quarterly attribution reporting at the channel level. Annual review of the attribution model itself.
The trap is sophistication. Algorithmic attribution sounds defensible until it’s a black box no one can interrogate when the CFO asks why the model assigned 12% credit to webinars this quarter and 23% last quarter. Simple models that are well-understood beat complex models that no one trusts.
Refine Labs has been making the broader argument for years: attribution will never be perfect, and the goal is consistent, directional data that informs decisions. For webinar programmes specifically, that means a model that gives webinars proportionate credit when they appear in the journey, rather than ignoring them because they sit in the middle.
The Metrics Stack: From Click to Closed-Won
Build a stack that runs from acquisition to revenue. Each layer informs different decisions.
Acquisition layer:
- Cost per registration
- Cost per attendee
- Channel-level acquisition efficiency
Engagement layer:
- Attendance rate
- Average dwell time
- Engagement score (chat, polls, questions, completion)
- Post-event content engagement
Conversion layer:
- MQL rate from webinar attendance
- SQL conversion rate by webinar topic
- Opportunity creation rate
- Sales acceptance rate of webinar leads
Revenue layer:
- Pipeline created per webinar (90-day window)
- Pipeline created per pound spent
- Closed-won revenue (180-day window)
- Average deal size, webinar attendees vs other channels
- Payback period
Use the acquisition layer for week-to-week campaign management. Use the engagement layer for post-event analysis and topic selection for the next quarter. Use the conversion layer to identify which webinar topics produce the highest-quality pipeline. Use the revenue layer for budget justification.
The mistake most programmes make is reporting only on the acquisition and engagement layers and ignoring the conversion and revenue layers because they take 90+ days to mature. The 90-day delay is unavoidable. The discipline is to track it anyway.
Justifying Webinar Budget at the Board Level
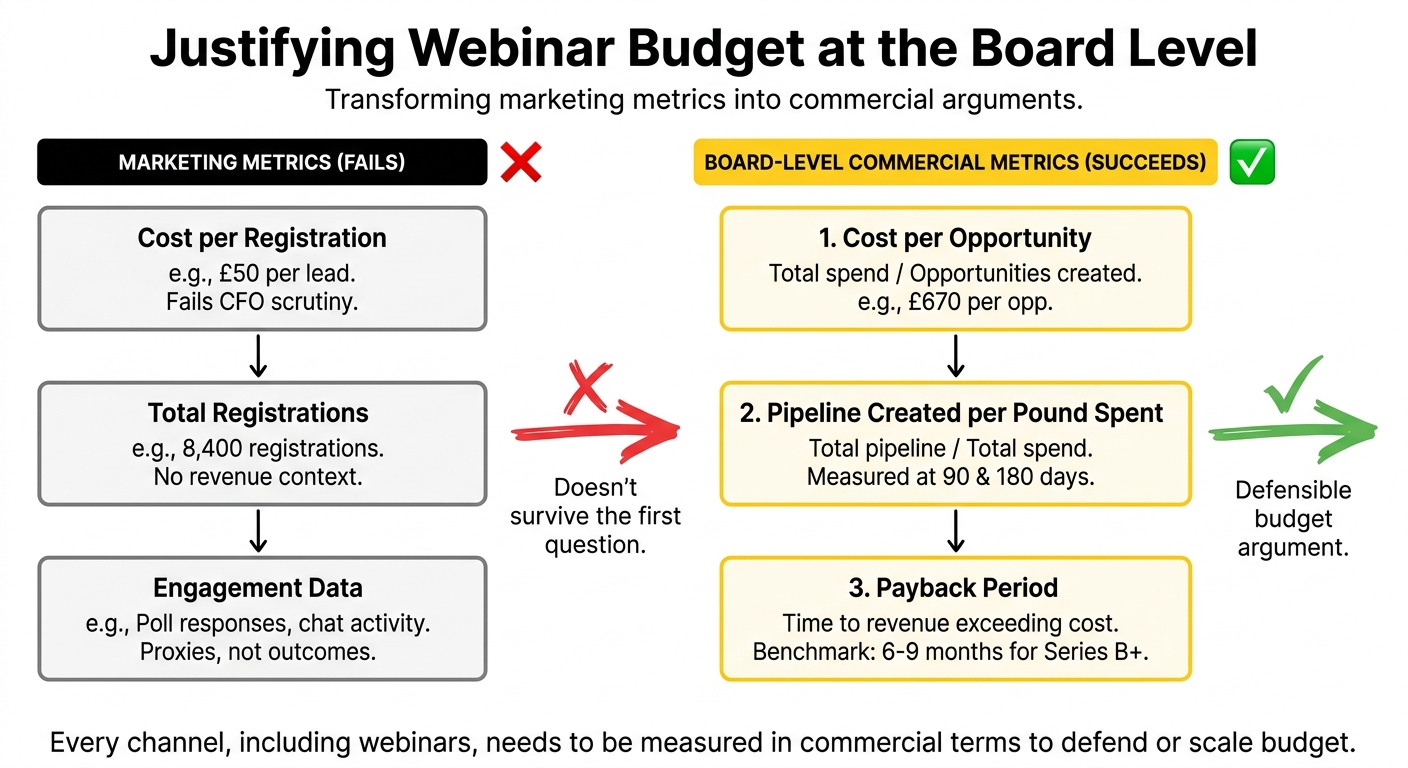
Budget justification falls apart when it’s framed in marketing-friendly metrics. Cost per registration doesn’t survive a CFO’s first question. Reframe the budget conversation in three commercial metrics.
Cost per opportunity, attributed to webinar. Take total programme spend (paid social, production, platform, time), divide by opportunities created where the webinar was a credited touchpoint. This is the metric that sits next to other channels in apples-to-apples comparisons.
Pipeline created per pound spent. Total pipeline contribution divided by total programme spend. Measured at 90 days for first reads, 180 days for the version that holds up to scrutiny.
Payback period. How long until closed-won revenue from the webinar cohort exceeds the programme cost. For Series B+ SaaS with ACVs above £30,000, well-run webinar programmes pay back in 6 to 9 months. Outside that range, the programme is either under-monetising the audience or over-spending on production.
When the CFO asks why webinars deserve a 20% increase in budget next year, the answer needs to be in these terms, not in registration counts. “We generated £4.2M of pipeline at a £670 cost per opportunity, with a 7-month payback period” is a defensible budget argument. “We had 8,400 registrations across the year” is not.
The same logic applies to broader marketing budget optimisation: every channel needs to be measured in commercial terms before its budget can be defended or scaled. Webinars are no different.
Common Pitfalls That Limit Webinar Revenue
Six pitfalls show up repeatedly across audits.
Optimising for registration volume rather than pipeline density. A webinar with 2,000 generic registrations produces less pipeline than one with 400 ICP-aligned registrations. Stop chasing volume.
Generic topics that don’t filter for intent. Broad topics attract attention. They don’t attract buyers. Tighter topics for clearer segments produce harder pipeline data.
No nurture between registration and event. Registration without nurture means 30 to 40% attendance rates. With proper nurture, 50 to 60% is achievable. The lift is operational, not creative.
Sales handoff that’s late or unstructured. A list dropped on sales 48 hours after the event with no segmentation produces low conversion. Hand off within 24 hours, with engagement-based prioritisation and topic context.
Attribution that doesn’t credit the webinar touch. If the model assigns webinars zero or minimal credit despite their actual influence, the programme will be defunded. Fix the attribution before scaling the programme.
One-off events instead of programmes. Single webinars produce single data points. Programmes (a quarterly cadence on linked themes) produce compounding audience and compounding pipeline. Don’t fund a webinar. Fund a webinar programme.
A 90-Day Webinar Programme Rollout for Series B+ SaaS
For Series B+ SaaS teams introducing or restructuring a webinar programme, this is the rollout that produces defensible attribution and pipeline data within one quarter.
Days 1 to 30: Foundation
- Define ICP segments and priority pain points
- Build the attribution model (W-shaped or position-based, agreed with sales and finance)
- Set up CRM tracking for webinar touches
- Pick the first three topics and the cadence (monthly is the practical default)
- Decide on the platform, production approach, and post-event handoff process
Days 31 to 60: Launch
- Run the first webinar
- Test paid social acquisition with two ad concepts and one offer (the webinar registration)
- Measure cost per registration and cost per attendee
- Run the post-event handoff and document where it breaks
- Iterate the second webinar based on learnings from the first
Days 61 to 90: Measure and scale
- Run the third webinar with refined acquisition, nurture, and handoff processes
- Pull cohort data on the first webinar (now 60 days post-event) for an early pipeline read
- Decide which topics produced the highest pipeline density and increase share of programme to those themes
- Build the quarterly review template that connects spend to pipeline at the cohort level
The goal at the end of 90 days isn’t a perfectly optimised programme. It’s enough cohort data to know which topics, audiences, and acquisition channels deserve continued investment, and a defensible attribution model that survives finance scrutiny.
How Upraw Approaches Webinar Programmes for SaaS Clients
Two patterns hold across the SaaS clients we run webinar programmes for.
The first is that webinars are rarely the bottleneck. The bottleneck is the integration between the webinar, the paid social media advertising campaign that fed it, and the sales motion that follows. Most VPs of Marketing think they need a better webinar. What they usually need is better handoff and tighter attribution.
The second is that the budget conversation gets easier the moment you have 90 days of cohort data. Before then, the programme defends itself with engagement metrics and good intentions. After, it defends itself with pipeline and payback period. The discipline of running for one full quarter before judging the programme is the single biggest determinant of whether it survives the next budget cycle.
For broader thinking on what good versus bad SaaS data looks like, our piece on The Most Sued Podcaster in SaaS (Nathan Latka) is worth a read, particularly if you’ve ever found yourself comparing your own metrics to numbers reported in podcasts and conference talks.
If you’re running webinars and the contribution to pipeline isn’t defensible at board level, the issue is rarely the events themselves. It’s the framework around them. Most of the work we do as a b2b digital marketing agency starts with auditing the integration between paid acquisition, webinar programmes, and pipeline measurement before changing any campaigns. If that’s where you are, we’re happy to take a look.
Frequently Asked Questions
Can you make money from webinars?
Yes, when the programme is structured as a revenue motion rather than a content engagement event. For Series B+ SaaS companies with ACVs above £30,000, well-run webinar programmes typically generate pipeline at a £500 to £900 cost per opportunity, with payback periods of 6 to 9 months. Programmes that fail to produce defensible revenue usually have weak post-event sales handoff, missing attribution credit for the webinar touch, or generic topics that attract registrations without filtering for buying intent.
What’s a good conversion rate for webinars?
A useful benchmark stack: registration page conversion of 15 to 30% from paid social, registration-to-attendance of 40 to 55% with proper nurture, attendance-to-MQL of 50 to 70%, MQL-to-opportunity of 15 to 25% over 90 days. The numbers vary by ICP, topic specificity, and sales motion. A webinar with high attendance but low MQL conversion suggests the topic attracted the wrong audience. Low attendance with high MQL conversion suggests strong audience fit but weak nurture.
How to convert online leads into sales?
The single biggest variable in webinar lead conversion is the speed and structure of the sales handoff. Hand off within 24 hours of the event, segmented by engagement signals (high engagement, asked questions, full attendance), with the topic context visible to sales. Sales follow-up should reference what the lead engaged with, not a generic “thanks for attending” template. The nurture flow continues for 30 to 60 days for leads that don’t convert immediately, since B2B buying timelines often extend beyond the event itself.
What are the best practices for leveraging webinars in social campaigns?
Tight ICP-aligned topics rather than broad themes, paid social acquisition optimised for cost per attendee not cost per registration, pre-event nurture sequences that lift attendance, post-event handoff within 24 to 48 hours, and attribution tracking that gives webinar touches proportionate credit. Run them as a quarterly programme rather than one-off events so audience compounds and pipeline data matures over time.
How can webinars be integrated into a multi-touch attribution model?
Treat the webinar as a discrete touchpoint in the journey, with three sub-events tracked separately: registration, attendance, and engagement signals (chat activity, polls, questions). In a W-shaped or position-based model, these typically fall in the lead-creation or opportunity-creation positions. The model doesn’t need to be sophisticated. It needs to be consistent, agreed with sales and finance, and applied to every closed-won analysis so the data accumulates comparably over time.
What metrics should be tracked to measure the success of webinars?
Track four layers: acquisition (cost per registration, cost per attendee), engagement (attendance rate, dwell time, engagement score), conversion (MQL rate, SQL rate, opportunity creation rate), and revenue (pipeline created per pound spent, closed-won revenue, payback period). Use acquisition metrics for weekly campaign management, engagement and conversion metrics for monthly programme review, revenue metrics for quarterly board reporting and budget justification.
How do you justify budget allocations for webinars in a marketing strategy?
Reframe the budget conversation in commercial metrics: cost per opportunity attributed to webinar, pipeline per pound spent, and payback period. CFOs don’t fund registrations. They fund pipeline at known cost. A programme that produces £4M of pipeline at £670 per opportunity with a 7-month payback period is defensible. A programme described as “8,400 registrations and strong engagement” is not. Run for at least one quarter before requesting budget increases so you have cohort data to argue from.
What are some real-world case studies of successful webinar-driven revenue?
The structural pattern across well-run programmes is consistent: tight ICP segmentation, monthly cadence, paid social acquisition through LinkedIn, pre-event nurture, sub-24-hour sales handoff, and attribution that credits the webinar touch. A typical Series B+ programme that follows this structure generates £2M to £5M in attributable pipeline per quarter at cost per opportunity figures comparable to or below other paid channels. Specific results vary by company, ICP, and ACV, but the structural pattern is what makes the programme work, not any single tactic.
How can you optimise marketing spend when using webinars as a lead generation tool?
Optimise three lever points in sequence. First, audience density: prioritise ICP-aligned segments that produce expensive registrations but high pipeline conversion over cheap broad-audience registrations. Second, attendance lift: invest in pre-event nurture sequences to convert paid registrations into engaged attendees rather than buying more registrations to compensate for low attendance. Third, post-event handoff speed: tighten the time between event and sales follow-up. Each of these compounds. Improving all three produces 2 to 3x improvements in cost per opportunity from the same baseline programme.
What role do webinars play in the sales cycle for B2B SaaS companies?
Webinars typically serve as a mid-funnel education and qualification touchpoint rather than a top-of-funnel awareness driver or a bottom-of-funnel closer. They work best when they help buyers in the consideration stage build conviction around a specific approach or framework, then surface engagement signals that sales can use for personalised follow-up. For long-cycle B2B SaaS deals (3 to 9 months), webinars often appear as the second or third meaningful touch in the journey, before the demo and after initial brand exposure.