Benchmarking B2B SaaS Digital Advertising Agencies
Benchmarking a B2B SaaS digital advertising agency requires more than asking 'What's your typical ROAS.' It requires understanding which metrics actually matter, how to calculate them consistently, and how they connect to your revenue outcomes. It requires knowing which metrics are vanity and which ones hold up in a board meeting.

Essential Metrics for Evaluating B2B SaaS Digital Advertising Agencies
Your CFO asks the question you dread. "What's the ROI on that Google Ads spend?" You pull together what you think is the answer. But halfway through explaining your multi touch attribution marketing model, you realise you're not sure if your agency is even measuring the same thing. And now you're sitting in front of your board trying to justify a seven-figure budget with metrics you can't fully defend.
This is the gap most VPs of Marketing inherit when evaluating B2B SaaS digital advertising agencies. Agencies speak in terms of cost-per-lead and impression volume. Your board speaks in revenue and payback period. The two languages rarely connect, and the person in the middle has to make it work.
Benchmarking a B2B SaaS digital advertising agency requires more than asking "What's your typical ROAS." It requires understanding which metrics actually matter, how to calculate them consistently, and how they connect to your revenue outcomes. It requires knowing which metrics are vanity and which ones hold up in a board meeting.
This article breaks down the essential metrics for evaluating B2B SaaS digital advertising agencies, how to benchmark them against realistic standards, and how to use that data to make informed decisions about agency partnerships that actually drive revenue accountability. For broader context, see our B2B SaaS PPC agency resource.
The Vanity Metrics Problem
Most digital advertising agencies lead with metrics that look impressive but don't connect to revenue. Cost-per-click. Click-through rate. Cost-per-lead. Impressions. These numbers are real. They're easy to track. And they're almost completely disconnected from whether your business is growing.
Here's why: a cost-per-lead of £15 sounds incredible until you realise that only 8 per cent of those leads convert to SQL and only 3 per cent of those SQLs close as customers. The lead cost matters far less than the cost-per-opportunity and the cost-to-close.
An exceptional agency understands this gap. It doesn't hide behind lead volume metrics. It connects your paid media spend to your revenue outcomes. This requires discipline and integration with your CRM. Many agencies resist this because it exposes the true efficiency of their work. But it's non-negotiable if you're accountable to your board.
When evaluating an agency, the first question is: which metrics does it actually report on. If the answer is limited to click metrics and lead volume, you've already identified a problem. The agency is optimising for what it can control, not what matters to your business.
The Essential Metrics Framework
Benchmarking an agency requires tracking metrics across four dimensions: efficiency, quality, attribution, and scaling.
Efficiency Metrics
Efficiency metrics tell you how much you're spending relative to the outcomes you're achieving. These are the metrics your CFO cares about.
Cost-per-opportunity (CPO) is the primary efficiency metric. Calculate it by dividing total paid media spend (creative, media buy, agency fees) by the number of marketing-qualified opportunities that reach your sales team. This is the true cost of each lead your sales team will evaluate. Unlike cost-per-lead (which includes duds), cost-per-opportunity accounts for lead quality and is directly comparable across channels and campaigns.
Example: If you spend £100,000 in a quarter and generate 250 qualified opportunities, your CPO is £400. That's the metric that matters. Everything else is noise.
Cost-to-close is the ultimate efficiency metric, but it's harder to calculate. Divide total paid media spend by the number of customers acquired through paid media. This includes the entire customer acquisition cost, not just the lead stage. A CPO of £400 that converts to customers at £2,000 cost-to-close is exceptional. A CPO of £200 that closes at £5,000 cost-to-close is a problem.
Agencies rarely want to track cost-to-close because it exposes the long tail of the funnel. But Series B+ companies should insist on it. If your sales cycle is six months and your average deal is £50,000, you need to know if paid media is contributing at a reasonable CAC.
Payback period measures how long it takes to recoup the cost of acquisition through customer revenue. If you acquire a customer for £2,000 and their ACV is £10,000 with an annual churn of 20 per cent, your payback period is roughly three months. Anything under six months is healthy for B2B SaaS. Agencies that can deliver consistent payback periods under six months are rare.
Quality Metrics
Quality metrics tell you whether the leads your agency generates actually match your ICP and convert.
MQL-to-SQL conversion rate is the gate between marketing and sales. Calculate it by dividing the number of marketing-qualified leads that become sales-qualified leads by the total number of MQLs. Industry benchmarks for B2B SaaS typically range from 5 to 15 per cent, but your specific rate depends on your ICP definition, sales process, and how tight your MQL criteria are.
If your agency's MQL-to-SQL rate is below 5 per cent, either the MQL definition is too loose or the agency is generating low-quality leads. If it's above 20 per cent, your MQL threshold may be set too conservatively. An agency should be able to articulate why its conversion rate falls where it does and what changes would improve it.
SQL-to-customer conversion rate tells you what percentage of sales-qualified leads actually close. This is often determined more by sales quality than marketing quality, but the agency should still care about it. If 20 per cent of the agency's SQLs close and only 5 per cent of inbound SQLs close, the agency is generating fundamentally different buyer intent.
Lead-source attribution accuracy is harder to measure but crucial. Ask your agency: of the customers you closed in the last 12 months, what percentage included a touchpoint from paid media at any stage of the funnel. For many B2B SaaS companies, this is 40 to 60 per cent. If your agency claims its campaigns touched only 15 per cent of closed customers, either the attribution model is wrong or the campaigns aren't reaching decision-makers.
Attribution Metrics
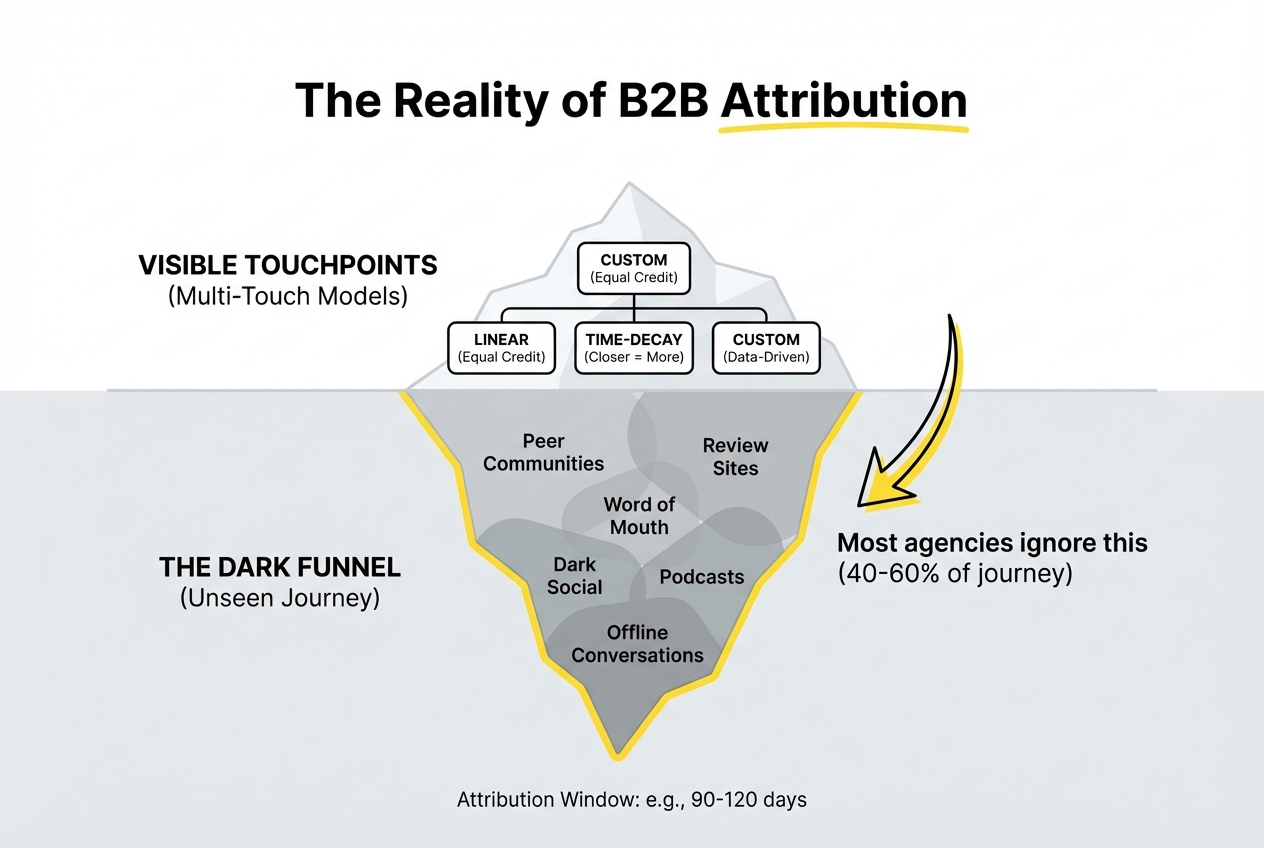
Attribution is where most B2B SaaS companies get stuck. Single-touch attribution (last-click wins) is simple but misleading. Multi-touch attribution is more accurate but requires constant adjustment and agreement on what to measure.
Multi-touch attribution model is the framework your agency uses to assign credit across all touchpoints in the buyer journey. There are several approaches:
Linear attribution assigns equal credit to every touchpoint. A prospect who encounters your webinar ad, reads a blog post, clicks a retargeting ad, and fills out a form gets equal credit across all four. This is simple but unrealistic.
Time-decay attribution gives more credit to touchpoints closer to conversion. The blog read might get 10 per cent credit while the form fill gets 40 per cent. This is more realistic but requires agreement on how much weight to assign to each stage.
Custom attribution uses your actual data to determine which touchpoints contribute most to conversion. If analysis shows that prospects who see your educational content are three times more likely to convert than those who don't, your model can reflect that.
The model your agency uses matters less than whether it's consistent, defensible, and aligned with your sales team's understanding of the buyer journey. Many agencies use last-click attribution because it's simple and makes their campaigns look better. But it undercounts the contribution of early-stage demand generation.
Attribution window is the timeframe within which touchpoints get credit. A 30-day attribution window captures the short funnel. A 90-day window accounts for longer consideration. Many B2B SaaS companies use a 120-day window to reflect the length of the sales cycle. Your agency should be able to defend its chosen window.
Dark funnel attribution is the challenge that most agencies won't acknowledge. Prospects research your competitor, read reviews, join peer communities, and talk to colleagues, none of which show up in your attribution model. Chris Walker and Refine Labs call this the "dark funnel," and it represents somewhere between 40 and 60 per cent of the buying journey. Your agency can't measure this directly, but it should acknowledge that its attribution is incomplete.
Scaling Metrics
Scaling metrics tell you whether the agency's results are repeatable and whether campaigns improve over time.
Learning velocity measures how quickly an agency optimises campaigns and moves budget to winning variations. In a mature campaign, the agency should be moving 10-15 per cent of budget from underperforming audiences to winning audiences every two weeks. If the agency is optimising quarterly instead of weekly, budget is being wasted on things that don't work.
Ask the agency: how often do you review performance data and adjust. Weekly is table stakes. Some exceptional agencies adjust daily. If the answer is "monthly," you've identified a scaling problem.
Cost-per-opportunity trend shows whether efficiency is improving, flat, or declining over time. Plot your CPO month-by-month. If it's declining, the agency is getting smarter. If it's flat or rising, the agency has hit a ceiling or the market has shifted. A declining CPO trend over 12 months indicates repeatable capability.
Volume scaling is the ability to increase campaign volume without sacrificing efficiency. Some agencies can scale from £10,000 per month to £50,000 per month and maintain CPO. Others can't because they've exhausted high-intent audiences and start targeting broader, lower-intent segments. Exceptional agencies build scaling into their strategy from the start. How to Build a SaaS PPC Engine for B2B SaaS (Not Just Run Ads), also on this blog, takes this further.
CAC payback period trend should improve over time as the agency builds audience data and messaging refinement. If payback period is 12 months at month three and still 12 months at month 12, the agency isn't learning.
How to Build Your Benchmarking Framework
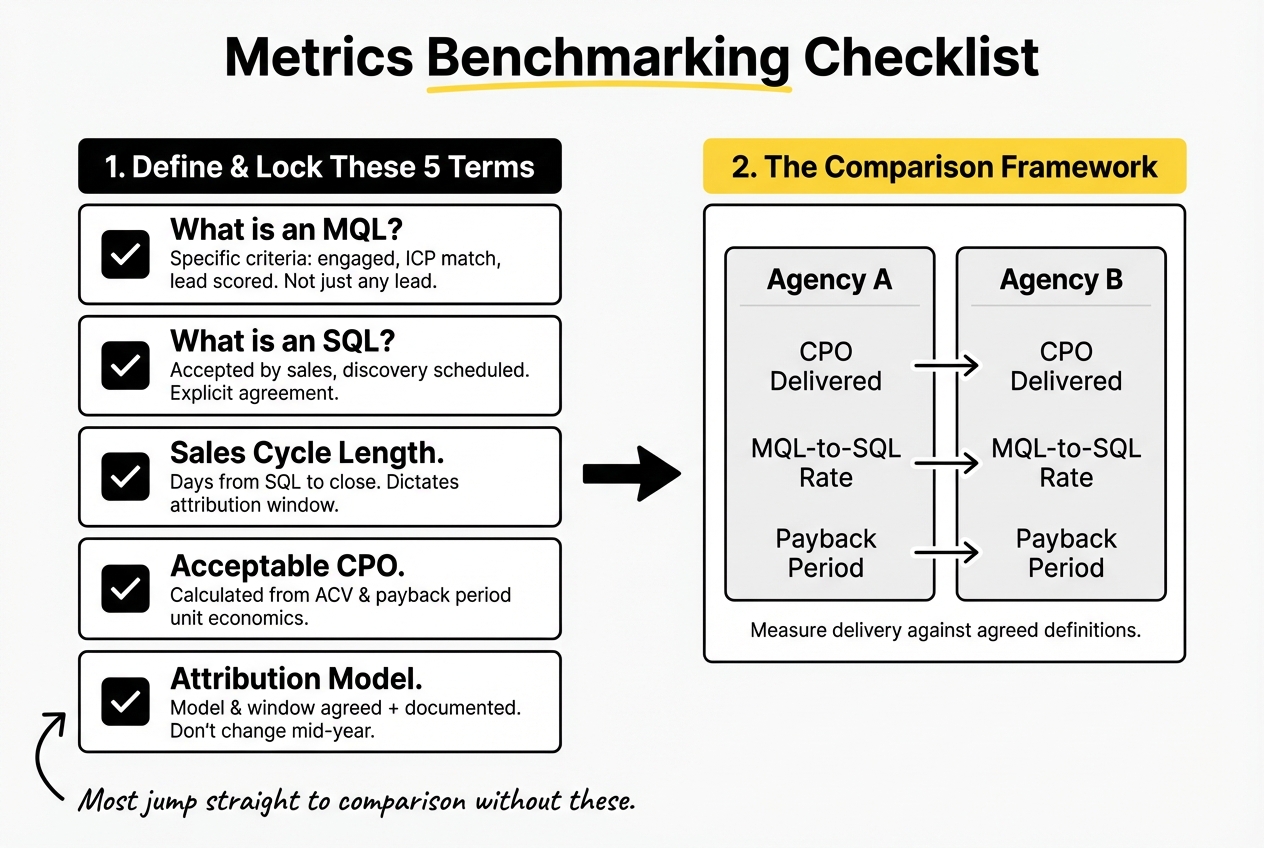
Benchmarking requires agreement on definitions. Before comparing agencies, define these terms for your business:
What is an MQL. Your definition should be specific: a contact who has engaged with demand capture content, matches your ICP on firmographic criteria, and has been flagged by your lead scoring system. Not every lead is an MQL. Many agencies over-define MQLs to make their conversion rates look better.
What is an SQL. Typically, a contact who has been accepted by sales and scheduled for discovery. But this varies. Some companies require a qualification call first. Define this explicitly and ensure your sales team agrees.
What is the sales cycle length. How many days does it typically take from SQL to closed deal. If it's 60 days, your attribution window should be at least 90 days to capture the full journey.
What is an acceptable CPO. Calculate this from your unit economics. If your ACV is £100,000 and your expected payback period is nine months, your acceptable CPO is roughly £5,000 to £8,000 depending on your churn assumptions. Work backwards from there.
What attribution model will you use. Discuss with your agency whether you'll use linear, time-decay, or custom attribution. Agree on the window. Document it. Don't change it midway through the year.
Once these definitions are locked, you have a framework for comparing agencies. You can measure whether each agency delivers the CPO, MQL-to-SQL rate, and payback period you need.
Benchmarking Against Reality
Industry benchmarks exist, but they're less useful than they seem. A SaaS company selling to mid-market healthcare has different benchmarks than one selling to enterprise financial services. A £10,000 ACV company has different economics than a £100,000 ACV company.
Instead of chasing industry benchmarks, benchmark against your own goals and your competitors' reported results.
Set internal benchmarks. What did your last agency achieve. If your previous CPO was £500 and your payback period was eight months, those are your benchmarks. A new agency needs to match or beat them. If the new agency promises £300 CPO, that's remarkable and should be tested rigorously.
Research competitor benchmarks. Some public SaaS companies disclose CAC and payback period metrics in their earnings calls. Calendly, Notion, and others have shared growth metrics. These aren't perfect comparisons, but they give you a sense of what efficient growth looks like in your space.
Account for differences. A Series A company with a brand-new product will have different benchmarks than a Series C company with established market position. A £50,000 ACV company will have different metrics than a £500,000 ACV company. Your agency should understand these differences and propose realistic targets.

The Multi-Touch Attribution Conversation
Most agency partnerships fail on attribution. The agency shows you numbers. Your sales team doesn't believe them. Your revenue outcomes don't match the agency's reporting. Everyone gets frustrated.
The solution is having a specific conversation about attribution at the start of the partnership.
Show the agency your data. Before the agency proposes an attribution model, show it your historical data. Which campaigns touch the customers you actually close. How many touchpoints does the average customer have before they convert. How long is the sales cycle. This grounds the attribution discussion in reality.
Agree on what can and can't be measured. Attribution will never be perfect. You can't track dark social, peer communities, or offline conversations. The agency should acknowledge this. But you should agree on what you will measure consistently.
Use a "last non-direct" model as a baseline. This credits the last click that wasn't direct traffic, which is more conservative than last-click but simpler than multi-touch. Many agencies use this as a starting point.
Track two models in parallel. Have the agency report both its preferred attribution model and a last-click model. This lets you see the difference and understand where the gaps are.
Review quarterly. Attribution assumptions change as you get more data. Review whether your model is still accurate and adjust. Your agency should be willing to do this.
What to Ask Your Agency
When benchmarking an agency, ask these specific questions:
What is your typical CPO for B2B SaaS clients. Push back if the answer is vague. Ask for specific numbers, by ACV band and sales cycle length.
How do you calculate MQL-to-SQL conversion rate and what is your typical range. The answer should include the MQL definition and context for why conversion rates vary.
What is your attribution model and how do you justify it. If the answer is "last-click," that's a red flag. The agency should have thought about this.
What does payback period look like in your campaigns, and how long does it typically take to hit target efficiency. The answer should acknowledge that there's a ramp-up period (usually months one to three) before efficiency stabilises.
How do you measure learning velocity. The answer should include how often campaigns are optimised and how budget is allocated across winning variations.
Can you share a reference client with similar ACV and sales cycle to mine. Ask that reference what the agency's actual metrics were and whether the agency over-promised.
Red Flags in Agency Reporting
Watch for these warning signs when an agency presents benchmarking data:
Vague metrics. "We drove significant pipeline growth" is meaningless. "We generated 150 SQLs at a cost of £450 each" is specific. Vague metrics hide problems.
High lead volume, low conversion. If an agency brags about generating 500 MQLs but can't show you the SQL conversion rate, the leads are probably low-quality.
Outdated benchmarks. "Our 2024 case studies show..." may be history. Ask for recent examples. Markets change fast.
No attribution discussion. If the agency has never discussed attribution with you, it hasn't thought about the full funnel. This is a problem.
Reluctance to access your CRM. Real measurement requires CRM integration. If the agency resists, it's avoiding accountability.
Improvement without explanation. "We improved your CPO by 30 per cent" is great, but why. Did audience targeting change. Did messaging shift. Did the market improve. Understanding why results changed is how you know if the improvement is repeatable.
The Upraw Perspective
At Upraw, we measure everything backwards from revenue. We know that a client's success is measured by whether paid media contributes to closed deals at an acceptable CAC. We've worked with agencies that couldn't defend their metrics and with agencies that had built rigorous benchmarking frameworks. The difference is stark.
The agencies we respect most are the ones that get uncomfortable with metrics that look good but don't drive revenue. They push back on MQL volume targets. They insist on CRM integration. They benchmark aggressively and adjust when targets aren't met. They treat benchmarking as a continuous conversation, not a quarterly reporting exercise.
Most agencies treat benchmarking like compliance. We treat it like the foundation of the entire partnership.
Frequently Asked Questions
What is multi-touch attribution marketing?
Multi-touch attribution is a measurement framework that assigns credit for a conversion across all the touchpoints a prospect encounters in their buyer journey, rather than giving all credit to a single interaction. In B2B SaaS, this is critical because buyers research your product across multiple channels (paid search, display, email, your blog, competitors' reviews) before engaging with sales. Multi-touch models reflect this reality more accurately than last-click attribution.
What is the difference between multi-touch attribution (MTA) and marketing mix modeling (MMM)?
Multi-touch attribution tracks individual customer journeys and assigns credit based on observed touchpoints. Marketing mix modeling uses statistical analysis to estimate the contribution of each channel to overall outcomes without tracking individual journeys. MTA is more precise but requires good data. MMM works when data is incomplete but requires assumptions. Most B2B SaaS companies should use MTA supplemented with MMM for channels where tracking is limited.
What are the key metrics to evaluate the performance of B2B SaaS digital advertising agencies?
The essential metrics are cost-per-opportunity (total spend divided by qualified opportunities), MQL-to-SQL conversion rate (the percentage of leads that become sales-qualified), payback period (time to recover acquisition cost), and cost-to-close (all-in cost per customer acquired). These four metrics are revenue-connected and defensible to your board. Secondary metrics include learning velocity (how fast the agency optimises) and cost-per-opportunity trend (whether efficiency improves over time).
How can MQL to SQL conversion rates impact the evaluation of advertising agencies?
MQL-to-SQL conversion rate reveals lead quality. If an agency generates 500 MQLs but only 25 convert to SQL (a 5 per cent rate), the agency is either using a loose MQL definition or generating low-intent leads. If the rate is 30 per cent, the MQL definition is too tight. By benchmarking this rate, you can assess whether the agency understands your ICP and can generate leads your sales team actually wants to pursue. A weak MQL-to-SQL rate is a red flag, regardless of lead volume.
What are some common challenges in implementing multi-touch attribution in B2B SaaS marketing?
The main challenges are data completeness (not all touchpoints are trackable), defining conversion events consistently, agreeing on attribution weight across stages, handling dark funnel interactions (research outside your tracking), and adjusting the model as your sales process evolves. Many companies also struggle with sales and marketing alignment on what constitutes an MQL. The solution is starting simple (linear attribution) and evolving to more sophisticated models as your data improves.
How does ROI factor into the benchmarking of B2B SaaS digital advertising agencies?
ROI (revenue generated divided by spend) is the ultimate benchmarking metric, but it's hard to calculate accurately in B2B SaaS because of long sales cycles and multiple touchpoints. Instead, use cost-to-close (all-in cost per customer) and payback period as proxies for ROI. If you acquire a customer for £3,000 and their ACV is £50,000, your ROI is roughly 1,566 per cent (or a 3-month payback). Your agency should be able to show this math for its past campaigns.
What are the best practices for measuring the effectiveness of digital advertising campaigns in the SaaS industry?
The best practices are: define your MQL and SQL criteria explicitly, track all touchpoints in your CRM, calculate cost-per-opportunity and payback period monthly, use multi-touch attribution rather than last-click, benchmark against your own historical performance rather than industry averages, and review attribution assumptions quarterly as your data improves. Most importantly, connect everything to revenue. If you can't draw a line from ad spend to closed deals, you're measuring the wrong things.
How can VPs of Marketing ensure that their chosen agency understands the SaaS landscape?
Ask the agency specific questions about B2B SaaS metrics, long sales cycles, multi-stakeholder buying decisions, and attribution challenges. Request case studies from companies with similar ACVs and sales cycles. Ask for references in your vertical. Ask how the agency handles the gap between MQL volume and SQL quality. The agency's answer to these questions will reveal whether it understands SaaS or is a generalist applying a one-size-fits-all approach.
What actionable insights should VPs of Marketing look for when evaluating agency performance?
Look for: which audiences are generating the lowest cost-per-opportunity, which messaging resonates most with decision-makers vs. researchers, where in the sales cycle paid touchpoints matter most, which campaigns have the shortest payback period, and which agencies are willing to sacrifice volume for quality. These insights let you optimise future campaigns and set realistic expectations with your team.
How can effective benchmarking lead to predictable scaling of paid search efforts?
When you benchmark an agency's performance (CPO, conversion rate, payback period), you create a repeatable model. If you know that £10,000 in spend generates 20 opportunities at a cost of £500 each with a 12 per cent close rate and nine-month payback, you can predict what £50,000 in spend will generate (with some variance for market saturation). Effective benchmarking turns paid search from a black box into a predictable engine. Agencies that can maintain consistent benchmarks as you scale are exceptional.
Key Takeaways
Benchmarking a B2B SaaS digital advertising agency requires moving beyond vanity metrics to efficiency, quality, and attribution metrics that actually connect to revenue. Cost-per-opportunity, MQL-to-SQL conversion rate, and payback period are the metrics that matter. Vanity metrics like cost-per-lead and impressions don't.
Multi-touch attribution is necessary because it's more accurate than last-click, but it requires agreement on definitions and continuous adjustment. Your agency should be able to defend its attribution model and acknowledge what it can't measure.
The best agency benchmarking frameworks are built at the start of the partnership, not retrofitted after problems emerge. Define your terms. Set realistic targets. Agree on attribution. Then measure relentlessly and adjust.
See our comprehensive guide to what makes great B2B SaaS agencies for broader context on agency selection.
If you're benchmarking agencies and need to cut through the noise, we're happy to review what potential partners are proposing and sense-check their metrics against your economics. This is what we do with SaaS teams regularly. Worth a conversation if you're at that stage.