Transforming Campaign Data into Strategic Decisions: Board-Ready Reporting for SaaS
Learn how to build board-ready paid media reports that translate campaign data into pipeline decisions. A practical framework for SaaS VPs of Marketing.

Your campaigns are running. Leads are coming in. Platform metrics look healthy. Then the board meeting arrives and someone asks: “What did paid media actually contribute to pipeline last quarter?”
If that question creates a scramble, the issue is not the performance. It is the reporting.
According to McKinsey’s 2026 B2B marketing research, 73% of CFOs cannot connect marketing spend to revenue outcomes. That gap is not a data problem. It is a framing problem. Marketing teams report what platforms show them: impressions, clicks, CPL, CTR. Boards care about pipeline, cost-per-opportunity, and CAC payback.
Closing that gap is what board-ready paid media reporting is designed to do. Not a prettier dashboard. A different kind of story.
Why Platform Metrics Don’t Survive Board Scrutiny
Standard reporting pulls directly from Google Ads or LinkedIn Ads. It shows the volume and cost of activity at the top of the funnel. Clicks went up. CPL came down. ROAS improved. These are not bad numbers to track. They just answer the wrong question.
Boards at Series B+ SaaS companies are evaluating marketing through one lens: what is the return on this spend, and should we increase it? A cost-per-click trend line does not answer that. A pipeline-to-spend ratio does.
The disconnect compounds in B2B SaaS because of the sales cycle length. A campaign running in Q3 might influence pipeline that closes in Q1. By the time a board sees closed-won data, it may be three quarters removed from the spend that drove it. Reporting that does not account for this lag will consistently understate the value of paid media. Or overstate it, depending on when you look.
What Board-Ready Paid Media Reporting Actually Contains
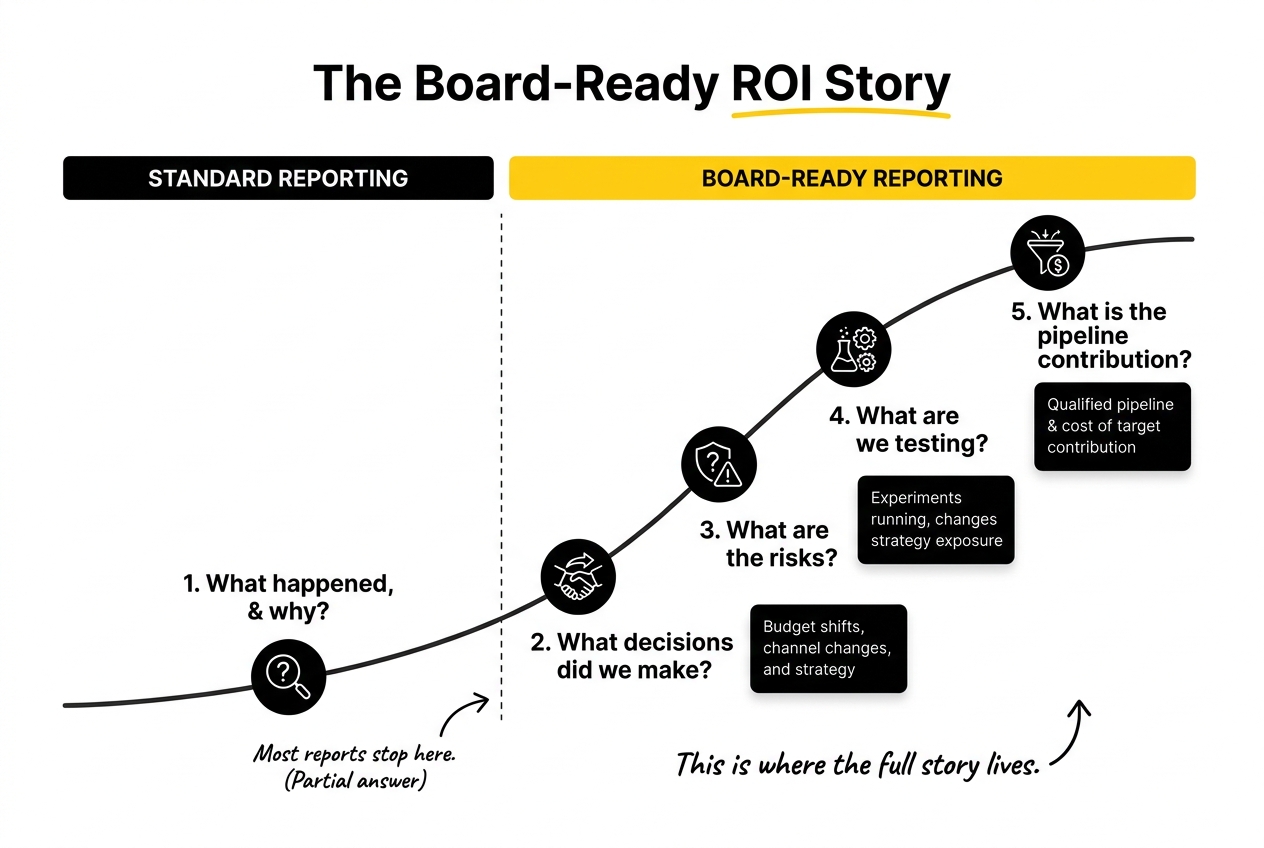
Board-ready reporting is not about format. It is not about a cleaner slide or a more elegant chart. It is about answering five questions that boards and CFOs consistently ask:
- What happened, and why? The narrative behind the numbers.
- What decisions did we make? Budget shifts, channel changes, and audience adjustments made because of the data.
- What are the risks? Where is the strategy exposed, and what could go wrong next quarter?
- What are we testing? What experiments are running, and what are we expecting to learn?
- What is the pipeline contribution? How much qualified pipeline can be attributed to paid media, at what cost?
Most reports answer question one, partially. Fewer answer questions two through five at all. That is where board-ready reporting differs from standard campaign reporting.
The Five Components of an Effective Board-Ready Paid Media Report
1. The Performance Narrative
Data without context is noise. A reporting section that shows click volume rose 14% without explaining whether that was driven by increased spend, improved Quality Score, or a seasonal shift gives the board nothing to act on.
The performance narrative explains what the data shows and what caused it. It is written in plain language, connects platform signals to business outcomes, and takes a position. “CPL increased in Q2 because we expanded into a new ICP segment. Early SQL rates from that segment are above average, which justifies the higher acquisition cost.” That is a narrative the board can evaluate.
Avoid the habit of listing metrics and hoping they speak for themselves. They rarely do to an audience outside the marketing team.
2. The Decisions Made
This section is often missing from standard reports, and its absence creates a trust gap. If marketing is making budget calls mid-quarter based on performance signals, the board should see that those calls are happening and understand the reasoning behind them.
“We reduced spend on competitor conquest terms by 30% after MQL-to-SQL conversion dropped to 8% over 60 days. We reallocated that budget to retargeting existing pipeline, where conversion to demo is 3x higher.” That kind of transparency demonstrates that the marketing team is running a disciplined operation, not just spending.
It also protects against retrospective criticism. If a budget shift led to a dip in MQL volume, documenting the reasoning in advance is far better than explaining it after a board question.
3. The Risk Register
Every board-ready report should contain a short, direct risk section. Not to catastrophise, but to show that the team is ahead of problems before they materialise.
Risks in paid media for B2B SaaS typically fall into a few categories: platform dependency (over-reliance on one channel without a mitigation plan), attribution fragility (reporting that breaks when a pixel misfires or a CRM integration lags), spend efficiency ceilings (campaigns approaching a point where incremental spend produces diminishing returns), and external factors such as competitor bidding activity, Google Ads policy changes, or shifts in buyer intent.
Identifying one or two specific risks per quarter, with a mitigation plan for each, shows the board a team managing the programme rather than just running it.
4. Upcoming Tests and Experiments
Testing communicates two things: that the current approach is not assumed to be optimal, and that the team has a structured plan for improving it. Both are reassuring to a board evaluating marketing leadership.
This section does not need to be a detailed experimental design. A brief entry covering what is being tested, what hypothesis is being evaluated, and what outcome would prompt a change is enough. “We are running a 30-day test of demand gen creative on LinkedIn targeting VP-level buyers in the 501 to 2,000 employee segment. If cost-per-MQL comes within 20% of our current average, we will shift 15% of LinkedIn budget to this segment in Q4.” That kind of framing shows strategic intent, not just activity.
5. Pipeline Contribution
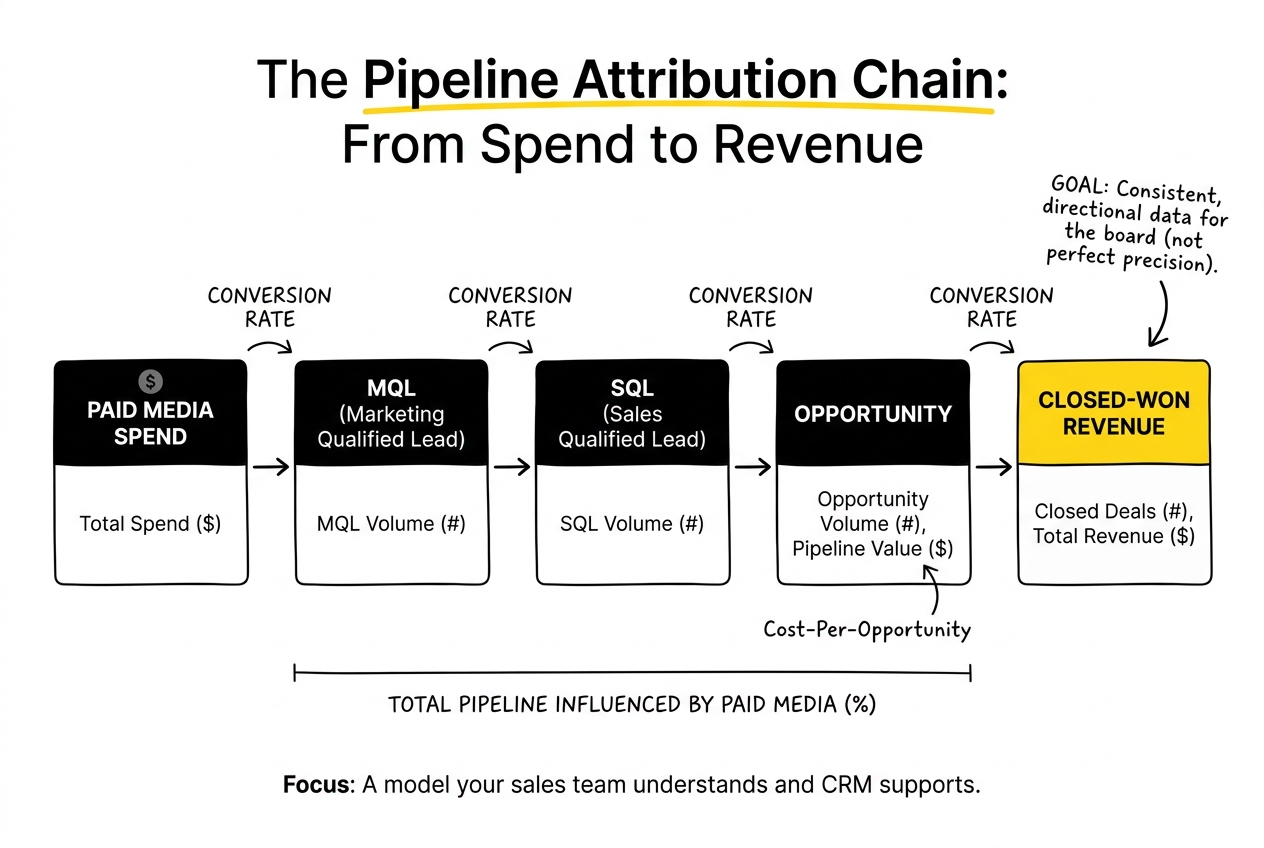
This is the number that matters most to the board, and the hardest to get right. Pipeline contribution connects paid media spend to qualified opportunities in the sales funnel, traced through to closed-won revenue where the sales cycle allows.
The most useful way to present this is through a pipeline attribution chain: spend to MQL, MQL to SQL, SQL to opportunity, opportunity to closed-won. Show the conversion rates at each stage. Show the cost-per-opportunity. Show the percentage of total pipeline that paid media influenced in the period.
Attribution will never be perfect in a multi-channel, multi-touch B2B journey. The goal is consistent, directional data that the whole organisation uses, not precision that changes depending on who pulled the report. Working with a model your sales team understands and your CRM can support is more valuable than a theoretically sophisticated approach that no one trusts.
Attribution Across Long Sales Cycles: Realistic Expectations
Series B+ SaaS companies typically have sales cycles running from 60 to 180 days, sometimes longer at higher ACV. Paid media often touches a buying committee at multiple points across that cycle: from an initial branded search to a LinkedIn retargeting ad that a champion shares internally before the final decision call.
Trying to credit each touchpoint with precision is a reasonable ambition. Treating any single attribution model as the complete truth is not.
The most practical approach for board-ready paid media reporting is to agree on a consistent attribution model with your sales team and apply it quarter over quarter. First-touch, last-touch, and linear models all have weaknesses. What matters is that the model is transparent, applied consistently, and understood by everyone reading the report.
Where CRM integration is clean (HubSpot or Salesforce with UTM parameters flowing through correctly), you can show influenced pipeline with reasonable confidence. Where the data is messier, be honest about the limitations and present ranges rather than point estimates.
The board does not expect perfection. It expects honesty and a clear plan to improve data quality over time.
Tools That Support Board-Ready Paid Media Reporting
The reporting layer is where many SaaS marketing teams lose time. Building reports manually from platform exports into a spreadsheet or slide deck is slow, error-prone, and difficult to keep consistent across quarters.
There are three broad categories of tools that help.
Data connectors and visualisation platforms pull spend data from Google Ads, LinkedIn Ads, and Meta, combine it with CRM data from HubSpot or Salesforce, and display it in a customisable dashboard. Funnel.io, Supermetrics, and Porter Metrics are commonly used in the SaaS space.
CRM-native attribution tools use the CRM as the source of truth for conversion tracking, reducing reliance on platform-reported data. They tend to be more reliable for pipeline contribution reporting because they are not dependent on each platform claiming maximum credit for the same conversion.
Board-specific reporting tools focus on narrative rather than raw data. They are designed to produce a concise summary, suitable for a board pack, that translates performance data into decisions. These are less widespread but increasingly relevant at Series B+ companies where the board pack is a formal quarterly deliverable.
The right tool depends on your CRM, data infrastructure, and the level of detail your board expects. For most Series B SaaS teams, a clean CRM integration with a visualisation layer on top is sufficient. The narrative still needs to be written by someone who understands the strategy.
Evaluating Agency Capability for Board-Ready Reporting
If paid media is managed externally, the quality of reporting reflects how well the engagement is structured. Not all agencies produce reporting that holds up at board level.
When evaluating an agency’s reporting capability, look for:
- Attribution transparency: Can they trace spend to MQL, SQL, and pipeline within your CRM, or are they reporting on platform conversions only?
- Narrative quality: Do reports explain the decisions made and the reasoning behind them, or do they present data and leave interpretation to you?
- Consistency: Is the same methodology applied quarter over quarter, or does the reporting format change when results are disappointing?
- Risk disclosure: Do they flag emerging issues proactively, or do problems only surface when you ask?
- Test documentation: Are experiments structured with a clear hypothesis and success criteria, or are changes made without a documented expected outcome?
An agency producing board-ready reporting is not just running campaigns. It is operating as a visible, accountable part of the marketing function at leadership level.
For a broader look at analytics infrastructure for SaaS paid media, see our board-ready paid media reporting saas agencies hub.
Putting It Into Practice
Building board-ready paid media reporting is not a one-quarter project. The data infrastructure, CRM integration, and attribution model take time to get right. The narrative discipline takes time to develop.
Start with the five-component structure outlined above. Even if some components are weaker in the first version, having all five present signals to the board that the team is operating at the right level of accountability.
Prioritise CRM integration before reporting sophistication. A simple attribution model with reliable CRM data is far more credible than a complex model built on platform estimates. The reporting will improve as the data improves.
Review the reporting framework quarterly with your agency or internal team. Board expectations evolve, and the reporting should evolve with them.
Frequently Asked Questions
What are the essential components of effective paid media reporting for SaaS companies?
Effective paid media reporting for SaaS contains five core elements: a performance narrative explaining what happened and why, a record of decisions made based on campaign data, a risk register flagging areas of exposure, documentation of upcoming tests and their hypotheses, and a pipeline contribution section tracing spend through MQL, SQL, and to closed-won revenue where the sales cycle allows.
How can VPs of Marketing present board-ready reports that align with revenue goals?
Align the report structure to the questions a board or CFO would ask, not to what the platform surfaces. Lead with pipeline contribution and cost-per-opportunity, not click volume or CPL. Frame budget decisions with the reasoning behind them, and include a forward-looking section on what the team is testing and why. The goal is to show that paid media is a managed investment, not a spend line.
What role does narrative play in communicating campaign performance to stakeholders?
Narrative is what makes data actionable. A board that sees CPL dropped 12% without context cannot evaluate whether that reflects improved targeting, reduced competition, or a shift toward lower-quality leads. Narrative connects the number to the cause, and the cause to a decision. Without it, reports create questions rather than confidence.
How can marketing leaders demonstrate ROI in marketing through paid media reporting?
ROI in paid media is most credibly demonstrated through a pipeline attribution chain: spend to MQL, MQL to SQL, SQL to opportunity, and opportunity to closed-won. Present cost-per-opportunity alongside cost-per-lead. Show the percentage of total pipeline that paid media influenced. Acknowledge the limitations of your attribution model and explain what steps are being taken to improve data quality over time.
What potential risks should be highlighted in paid media reports for board discussions?
The risks most relevant to board-level discussions include platform dependency (heavy reliance on a single channel without a mitigation plan), attribution fragility (reporting that breaks when CRM or tracking integrations fail), spend efficiency ceilings (where incremental budget produces diminishing returns in pipeline), and external factors such as competitor bidding intensity or Google Ads policy changes.
How can upcoming tests be effectively communicated in paid media reporting?
Present each test with three elements: the hypothesis being evaluated, the variable or segment being tested, and the outcome threshold that would prompt a budget or strategy change. Boards do not need the experimental design detail, but they benefit from seeing that testing is structured and purposeful. One or two documented tests per quarter is a credible cadence.
What tools or software can help automate the creation of summarised reports for decision-making?
Data connector and visualisation platforms such as Funnel.io, Supermetrics, and Porter Metrics automate the aggregation of spend data across channels and connect it to CRM data for pipeline attribution. CRM-native attribution tools use the CRM as the source of truth for conversion tracking. The narrative layer still requires human input: no campaign data decision-making software yet writes the interpretation, decisions, and risk sections reliably.
How can campaign data be translated into actionable insights for multi-stakeholder B2B journeys?
Start by mapping which paid media touchpoints correspond to stages in your sales cycle. Use CRM data to understand where paid media is contributing to pipeline movement, not just lead generation. Where possible, present data by buying committee role (the economic buyer, the champion, the end user) to show that targeting reflects the complexity of how deals actually close.
What strategies can help justify SaaS marketing budget allocation based on paid media performance?
The most credible justification for budget is a pipeline attribution model that connects spend to qualified opportunities at a consistent cost-per-opportunity. Present cost-per-opportunity trend data over multiple quarters to show efficiency improving or stabilising. Where budget increases are requested, model the expected pipeline impact based on historical conversion rates, rather than projecting from top-of-funnel metrics alone.
How do you use data and analytics to refine marketing campaigns and make informed decisions?
Refinement decisions should trace back to specific signals within the pipeline attribution chain. An increase in MQL volume with a declining MQL-to-SQL rate points to a targeting or qualification problem, not a spend problem. A healthy MQL-to-SQL rate with slow pipeline velocity points to a sales cycle issue. The data should identify where in the funnel the problem or opportunity sits before any decision is made about where to adjust.
If you are working through how to get this right for your organisation, it is the kind of problem we work through with SaaS teams regularly. Worth a conversation if you are at that point.