Creating a Source-of-Truth Dashboard for B2B SaaS PPC
Learn to integrate ad platforms, CRM, and product analytics into a unified dashboard for effective B2B SaaS PPC measurement and reporting.

Your Google Ads says cost per lead is £48. HubSpot shows £71. The CFO has a spreadsheet with £94. The board meeting is on Thursday.
This is not a reporting problem. It is a data architecture problem. And it is far more common than marketing operations teams want to admit. According to the 2025 State of B2B Marketing Attribution report, nearly 90% of B2B SaaS marketers report either moderate data silos or significant integration challenges. Only 10.6% say they have fully unified data access.
A source-of-truth dashboard for B2B SaaS PPC does not add a fourth number to that argument. It resolves the disagreement by making one number the agreed reference point for every team that touches pipeline. This guide covers what that dashboard needs to do, what it takes to build it, and where most teams go wrong.
What a Source-of-Truth Dashboard Actually Is
A source-of-truth dashboard is not a reporting layer. It is the canonical version of reality that all other reports should reconcile to.
The distinction matters because most B2B SaaS teams already have dashboards. They have a Google Ads dashboard, a LinkedIn dashboard, a HubSpot or Salesforce dashboard, and usually a set of manual Google Sheets pulling from all three. Each one is accurate within its own walls. The problem is the walls.
A source-of-truth dashboard integrates data from ad platforms, CRM systems, and product analytics into a single, governed view. It defines how every metric is calculated, where the data comes from, and which system wins when numbers conflict. It is less a visualisation tool and more a measurement contract between marketing, sales, RevOps, and finance.
For B2B SaaS PPC specifically, this matters because the buyer journey does not behave the way ad platforms report it. The average B2B buyer journey now lasts over 200 days and involves multiple stakeholders. A paid search click that fires a Google Ads conversion is often one of dozens of touchpoints across weeks. Platform-reported ROAS routinely overstates contribution because platforms are incentivised to claim credit for anything they can.
The only way to have a number you can defend in a board meeting is to own the calculation yourself, from a data source no ad platform controls.
The Key Components of a B2B SaaS Marketing Dashboard
Not every metric belongs in a source-of-truth dashboard. The purpose of this build is not to replicate everything your platforms already show. It is to surface the metrics that cannot be accurately reported from any single platform.
Pipeline contribution by channel is the first tier. This is marketing-influenced pipeline measured from the CRM, not from ad platform conversion tracking. It answers: which channels touched deals that closed, and at what stage? This is where CRM integration becomes non-negotiable. Without GCLID or UTM data flowing cleanly from ad platform to CRM, this number is a guess.
Cost per opportunity and cost per qualified pipeline matter more than cost per lead for SaaS teams selling to buying committees with long cycles. Lead volume at low CPL is easy to manufacture. Pipeline that sales will actually work is the constraint.
MQL-to-SQL conversion rate by source is often the single most revealing metric in the dashboard. The overall average for B2B SaaS sits around 13%, but it masks enormous variance by channel. If your PPC-sourced leads are converting to SQL at 8% while organic is at 25%, that gap is doing more to set your blended CAC than your bid strategy. Cost Per Acquisition (CPA) - The Most Critical PPC Metric, also on this blog, takes this further.
Time-to-opportunity by source connects paid media performance to sales cycle reality. A channel generating cheap leads that take 180 days to become opportunities creates a very different cash flow profile than one generating more expensive leads that move in 60.
Attribution model used should be surfaced explicitly in the dashboard. Not hidden in a settings menu. Teams that share a dashboard without knowing which attribution model underpins it will draw different conclusions from the same data.
The following metrics should also be included:
- Closed-won revenue attributed by channel (CRM source, not platform-reported)
- CAC payback period by segment (SMB, mid-market, enterprise)
- Conversion rate by funnel stage, by source
- Platform spend vs. CRM pipeline ratio (the simplest version of ROAS you can actually trust)
Integrating Data Sources for SaaS Analytics
The architecture question behind a source-of-truth dashboard is: which system is the master record for which data type?
The CRM should be the master record for all pipeline and revenue data. Not Google Analytics. Not the ad platform. The CRM is where opportunities, deal stages, and closed-won revenue live. Every downstream report should trace back to CRM data for anything pipeline-related.
Ad platforms are the master record for spend data only. Impression volume, click data, and spend should come directly from the platform APIs. But conversion data from platforms should be treated as supplementary, not definitive.
Product analytics (Amplitude, Mixpanel, or similar) becomes relevant when measuring post-click behaviour: trial activation rates, onboarding completion, and product-qualified lead signals. For SaaS teams running a PLG motion or hybrid model, PPC performance cannot be fully understood without connecting ad-sourced acquisitions to product activation data.
The connection layer between these systems is where most implementations fail. The practical requirements are:
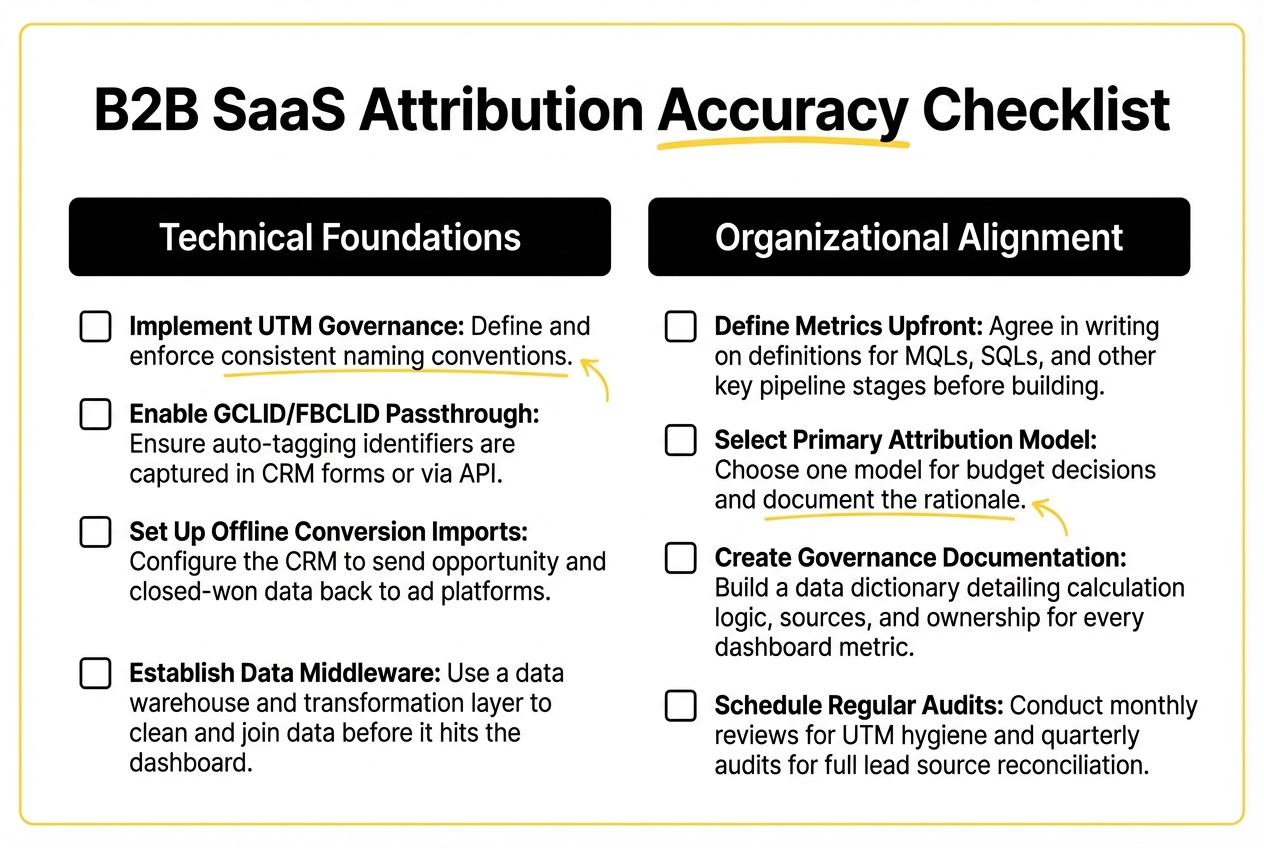
UTM governance. Every paid media URL needs consistent UTM parameters: source, medium, campaign, content, and term. The naming conventions must be agreed and documented before launch, and enforced through a shared UTM builder. If one team calls a campaign “google_brand” and another calls it “brand_google”, you will never reconcile your channel data cleanly.
GCLID and FBCLID passthrough. Auto-tagging in Google Ads and equivalent identifiers in Meta and LinkedIn need to pass through to the CRM via form submission or API. Without this, ad platform sessions cannot be matched to CRM contacts.
Offline conversion imports. For B2B SaaS with sales-assisted deals, opportunity and closed-won events should be imported back into Google Ads and other platforms as offline conversions. This closes the loop between ad spend and actual revenue, and allows smart bidding algorithms to optimise toward signals that reflect real pipeline rather than form fills.
Data warehouse or middleware. For teams managing more than two or three ad platforms, connecting each platform directly to the CRM becomes fragile. A data warehouse layer (BigQuery, Snowflake) with a transformation tool (dbt, Fivetran) creates a single place where data from all platforms is cleaned, standardised, and joined before it hits the dashboard layer.
Tools commonly used at the dashboard layer include Looker Studio for cost-effective builds, Tableau and Power BI for teams with existing BI infrastructure, and purpose-built revenue attribution platforms like Dreamdata or HockeyStack for teams that want the pipeline join done for them. The right choice depends on the maturity of your data infrastructure, not the size of your budget.
.jpeg)
Common Challenges When Building a Source-of-Truth Dashboard
The technical work of connecting platforms is less difficult than most teams expect. The organisational work is harder.
Agreeing on definitions before building. The most common reason source-of-truth dashboards fail is that they are built before the team has agreed on what the metrics mean. What counts as an MQL? Is a demo request from a non-ICP company an MQL? If a deal is influenced by paid media but closed through an outbound SDR sequence, which channel gets credit? These questions need written answers before a single connector is configured.
Attribution model disagreement. Marketing wants multi-touch. Sales wants first-touch. Finance wants last-touch because it is the simplest. The dashboard should surface one agreed model as the primary view, with the ability to switch models for analysis. The primary model is the one used for budget decisions. The others are for context.
Data quality management. A dashboard is only as reliable as the data feeding it. Duplicate contacts in the CRM, broken UTM parameters, inconsistent lead source fields, and gaps in offline conversion imports will all produce numbers that look plausible but are wrong. Data quality management is not a one-time task. It requires a regular audit cadence, typically monthly for UTM hygiene and quarterly for full lead source reconciliation.
Governance documentation. Every metric in the dashboard should have a data dictionary entry: how it is calculated, which system it comes from, when it was last validated, and who owns it. Without documentation, every team member who joins after the initial build will interpret the metrics differently. Six months later, you are back to multiple versions of truth.
Refine Labs have long argued that the attribution gap in B2B SaaS is structural, not a tooling problem. The dark funnel, the buying committee research that happens before anyone fills out a form, means even the best-configured source-of-truth dashboard will undercount channel contribution. The goal is not perfect attribution. It is consistent, directional data that holds up over time and enables better budget decisions than platform-reported ROAS.
Best Practices for B2B SaaS PPC Dashboard Reporting
Once the dashboard is built, how it is used matters as much as what it contains.
Standardise the reporting cadence. Weekly reviews should focus on spend efficiency and conversion rate trends. Monthly reviews should connect ad performance to pipeline contribution. Quarterly reviews should assess CAC payback by channel and make budget reallocation decisions. Each cadence has different stakeholders and different questions. The dashboard should support all three without requiring the marketing ops team to rebuild the view each time.
Make the attribution model visible. Every time the dashboard is shared with a stakeholder, the attribution model in use should be stated clearly. “This is first-touch attribution. It will overstate the contribution of brand awareness campaigns and understate the contribution of nurture and retargeting.” This context prevents the number from being misread by people who do not live in the data every day.
Build in cross-functional access. The value of a source-of-truth dashboard is not just what marketing does with it. It is what stops the argument between marketing, sales, and finance when the numbers diverge. For it to perform that function, sales leadership and the CFO need to be able to open it. The governance documentation needs to be accessible to them, not buried in a Notion page only the marketing ops team can find.
Version control your metrics. When the definition of an MQL changes, or when a new attribution model is adopted, the historical data will shift. Document these changes with dates. “MQL definition updated March 2026: now requires ICP firmographic match in addition to behaviour score.” Without this, year-on-year comparisons become unreliable.
.jpeg)
How a Source-of-Truth Dashboard Streamlines Reporting
The operational benefit that teams rarely quantify before building is time.
The 2025 State of Marketing Attribution report found that the average martech stack now runs between 17 and 20 platforms. More than half of marketers using attribution tools cannot track marketing cost per £1 of pipeline. The connective tissue is missing, and the gap is filled by manual consolidation work that typically falls on one or two people in marketing ops.
A well-built source-of-truth dashboard eliminates most of that consolidation. The pipeline contribution numbers update automatically. The spend data pulls via API. The CFO can open the dashboard on Thursday morning instead of waiting for someone to send a spreadsheet.
More importantly, it changes the character of reporting conversations. Instead of spending the first 20 minutes of a marketing review reconciling which number is right, teams spend that time on the question that actually matters: what does this tell us about where to put the budget next quarter?
That shift, from reconciliation to decision-making, is the real return on investment for this build.
Frequently Asked Questions
What is a Source-of-Truth Dashboard for B2B SaaS?
A source-of-truth dashboard is a single, governed reporting environment that integrates data from ad platforms, CRM systems, and product analytics into one canonical view. It defines how every metric is calculated and which system is the master record for each data type. For B2B SaaS PPC, it replaces the conflicting numbers across platforms with one agreed version of pipeline performance that all teams use for budget and strategy decisions.
How can a Source-of-Truth Dashboard improve data integrity in marketing operations?
Data integrity improves when there is a single agreed definition for every metric and one master data source for each type. The dashboard enforces this by building the calculation logic into the reporting layer rather than leaving it to individual spreadsheets. Regular data quality audits, governance documentation, and consistent UTM naming conventions maintain integrity over time.
What are the key components of a marketing dashboard for B2B SaaS?
The most important components are: pipeline contribution by channel (from CRM, not platform), cost per opportunity, MQL-to-SQL conversion rate by source, time-to-opportunity by source, closed-won revenue by channel, and CAC payback by segment. The attribution model in use should also be explicitly labelled in the dashboard.
How do you integrate data from multiple ad platforms into a single dashboard?
The recommended approach is to use consistent UTM parameters across all platforms, enable GCLID and equivalent identifier passthrough to the CRM, import offline conversion events from CRM back to ad platforms, and route all platform data through a central data warehouse before connecting to the dashboard layer. Tools like Fivetran or dbt can handle the transformation layer.
What challenges do B2B SaaS companies face when building a Source-of-Truth Dashboard?
The most common challenges are: disagreements on metric definitions before the build begins, conflicting attribution model preferences across teams, data quality issues in the CRM (duplicate contacts, broken UTM parameters), and lack of governance documentation. The technical integrations are less difficult than the organisational alignment required to make the dashboard a shared reference point.
What best practices should be followed when creating a marketing dashboard?
Agree on metric definitions in writing before building. Choose one primary attribution model and document why. Build in cross-functional access so sales and finance can use it directly. Establish a tiered reporting cadence (weekly for efficiency, monthly for pipeline, quarterly for budget). Version-control any changes to metric definitions with dates.
How can attribution accuracy be ensured in a Source-of-Truth Dashboard?
Attribution accuracy depends on data infrastructure, not model selection. The foundations are: consistent UTM tagging, GCLID passthrough to CRM, offline conversion imports, and a regular audit cadence to identify gaps. Even with best-in-class infrastructure, some contribution will remain dark. The goal is consistent, directional accuracy over time, not precision.
What tools are commonly used to build a Source-of-Truth Dashboard in B2B SaaS?
At the data layer: BigQuery or Snowflake for warehousing, Fivetran or Stitch for connectors, dbt for transformation. At the visualisation layer: Looker Studio for cost-effective builds, Tableau or Power BI for teams with existing BI infrastructure. Purpose-built attribution platforms like Dreamdata or HockeyStack handle the CRM-to-pipeline join and reduce implementation overhead for teams without dedicated data engineering resource. For more on marketing analytics for SaaS, see our hub.
How can a Source-of-Truth Dashboard streamline reporting processes?
By connecting platform spend data and CRM pipeline data through a governed data layer, the dashboard eliminates manual report consolidation. The numbers update automatically, and every stakeholder accesses the same view. Teams stop spending the first portion of every review reconciling which number is correct and spend that time on budget and strategy decisions instead.
What metrics should be prioritised in a B2B SaaS marketing dashboard?
Prioritise metrics that cannot be accurately reported from any single platform: marketing-influenced pipeline from CRM, cost per opportunity, MQL-to-SQL conversion rate by source, and closed-won revenue by channel. Platform-specific metrics like ROAS and impression share should be monitored within the platforms themselves, where the context is cleaner.
If you are working through the data architecture for this kind of build, or finding that the numbers in your current setup do not hold up in board conversations, this is the kind of problem we work through with SaaS teams regularly. Worth a conversation if you are at that point.