Cost Per Acquisition (CPA) in PPC: The Most Critical Metric
The starting point for any PPC campaign is crystal clear goals. Sit down and consider what you’re trying to achieve. In my experience many people answer this fundamental question with arbitrary goals like “generate leads”…

The starting point for any PPC campaign is crystal clear goals. Sit down and consider what you’re trying to achieve. In my experience, many people answer this fundamental question with fairly arbitrary goals like “generate leads” or “deliver a return”. Neither tells you much unless you understand what those leads are worth and how much you can afford to pay for them.
You may be confident that leads with a $30 CPA are profitable, but that doesn’t mean you can buy unlimited volume at $30. As you scale, you usually move beyond the cheapest and most obvious demand. CPA starts to rise, and eventually you reach a tipping point where more conversions no longer improve the bottom line.
In this article, I’ll explain what cost per acquisition means in PPC, how to calculate CPA, and how to set a max CPA and target CPA that keep growth tied to profitability.
What is CPA in PPC?
CPA, or cost per acquisition, is the average amount you spend to generate a defined conversion or acquire a customer through PPC. You calculate it by dividing the total campaign cost by the total number of acquisitions.
CPA = total campaign cost ÷ total acquisitions
For example, if you spend $2,000 and acquire 20 customers, your CPA is $100. In an advertising platform, the acquisition could also be a free trial, demo request or another conversion action you have chosen to track. That distinction matters because a free trial CPA is not the same as the amount you ultimately pay to acquire a customer.
The percentage of customer lifetime value, or CLV, that you’re prepared to spend is better thought of as your target or maximum CPA. Let’s say each new client generates $2,000 over the lifetime of the relationship. Spending less of that value on acquisition generally protects more profit but may limit growth. Spending more can open up additional volume, but it also leaves less room for profit.
Your max CPA is the most you can afford to spend before the acquisition becomes unprofitable. Your target CPA is the amount you actually aim for once you have allowed for the profit you want to retain. We’ll calculate both in a moment.
The CPA curve: why CPA increases as you scale
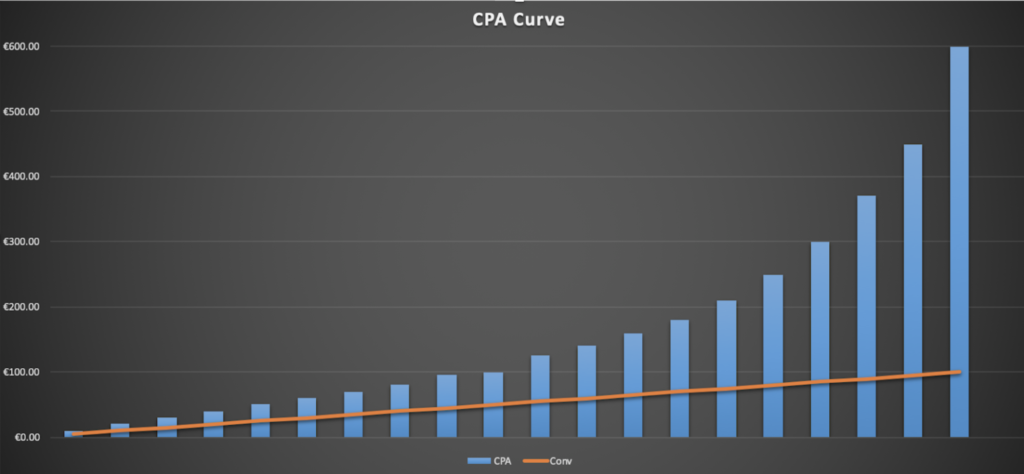
A traditional CPA curve looks like the graph above. As you scale conversion volume, CPA will often increase because you begin moving beyond the cheapest, highest-intent demand. After a certain point, the marginal cost of each additional conversion can rise sharply, creating a hockey-stick curve. Not the good kind.
There is a finite amount of conversion volume available within each CPA range. To give you a simple example, let’s say you’re a time-tracking SaaS company. It makes sense to begin with search campaigns targeting the obvious lower-funnel keywords, such as:
- Time-tracking software
- Time-tracking tools
- Software to track employees
You find that you’re able to generate around 250 free trial users per month at an average CPA of $25. That’s great. You know this is well below your max CPA, so naturally you want more.
Unfortunately, there are only so many people actively searching for a product just like yours. Because you want to keep growing, you start looking for new keyword opportunities. You’ve exhausted the obvious choices, so you move towards more mid-funnel searches such as:
- How do I track my time
- Workplace efficiency tools
- Time-tracking spreadsheet
These users may still be interested in your software, but they’re at a different stage of the funnel. They know they have a problem, but they’re still researching potential solutions. You may find that these new keywords generate another 100 trial users per month, but at an average CPA of $50 rather than $25.
Those additional trials have a marginal CPA of $50, even if the blended CPA across the whole account is lower. This is why it’s important to look at the cost of gaining more conversion volume rather than relying only on your overall average. As you scale your PPC campaigns, you need to understand the point at which the cost of the next conversion is no longer justified by the value it creates.
How to calculate your CPA
The basic cost per acquisition calculation is straightforward:
CPA = total campaign cost ÷ total acquisitions
If you spend $10,000 and generate 100 acquisitions, your CPA is $100. That tells you what you paid. To understand what you can afford to pay, you need to reverse engineer your max CPA and target CPA from customer lifetime value.
The most important starting point is CLV, or customer lifetime value. This is the average amount each client generates over the lifespan of the relationship. You can calculate it in different ways depending on your business model, but we’ll keep things simple for now.
Example 1: Your customers make one purchase
If every customer buys once, a basic CLV calculation is:
Total revenue ÷ total customers = CLV
Example 2: You’re a SaaS business and customers pay monthly
For a simple SaaS calculation, you need to know the average monthly revenue per customer and your monthly churn rate, which is the percentage of customers who cancel each month.
Average monthly revenue per customer ÷ monthly churn rate = CLV
Let’s say your average customer pays $500 per month and monthly churn is 10%.
$500 ÷ 0.10 = $5,000 CLV
This is a simplified calculation, but it gives us a useful starting point. Once you have your CLV, subtract the costs associated with serving that customer over the lifetime of the relationship. These might include onboarding, customer support, payment fees, account management and usage-based infrastructure. If you also want to allocate overheads such as software or office costs, make sure you do so consistently.
Max CPA = CLV − lifetime customer costs
In this example, you calculate that the average customer has $1,000 in lifetime costs. Subtracting that from the $5,000 CLV leaves $4,000.
Your break-even max CPA is therefore $4,000. That’s the absolute ceiling before allowing for the profit you want to retain or any other acquisition costs that aren’t already included in the model.
Funnel steps
Another critical part of the calculation is understanding the funnel users travel through before they become customers. Using our SaaS example, it’s common for potential customers to sign up for a free trial before they become paying customers. If 10% of free trial users convert into paying customers, you need to factor that conversion rate into your max CPA.
Max free trial CPA = max customer CPA × trial-to-customer conversion rate
Using the numbers above:
$4,000 × 0.10 = $400
Your max CPA for a free trial user is therefore $400, not $4,000. Only one in ten trial users becomes a customer, so the value of each individual trial needs to reflect that.
The same principle applies to every other funnel step. Maybe you’re promoting a white paper to bring value to potential clients. If 2% of people who download it eventually become paying customers, the calculation would be:
$4,000 × 0.02 = $80
Your max CPA for a white paper download would be $80. You can use the same calculation for demo requests, consultations, webinar registrations and other conversion points, provided you have a reasonable estimate of how often each one becomes a customer.
Real SaaS funnels are usually more complicated than this. Conversion rates fluctuate, different customer segments have different values, and it can take a decent amount of data before the numbers become reliable. It isn’t an exact science, but even a sensible estimate will put you ahead of advertisers who optimise purely around whatever CPA appears in the ad platform.
If you'd like to explore the relationship between funnel structure and conversion goals further, check out our blog on Structuring SaaS PPC Accounts for PLG vs Sales-Led Funnels.
Cost per acquisition vs cost per conversion and cost per lead
This is where the terminology can get messy. Ad platforms often use CPA and cost per conversion interchangeably because they calculate the average cost of whatever conversion action you have told them to track. If your primary conversion is a free trial, the CPA shown in the platform is really your cost per free trial. It isn’t automatically your cost per paying customer.
Cost per lead is narrower again. It tells you what you spend to generate an initial lead, such as a demo request, consultation or content download. Cost per acquisition should describe the cost of acquiring the final customer, although plenty of reporting setups use the term for an earlier conversion stage.
Neither approach is necessarily wrong, but you need to be clear about what each number represents. A $100 demo CPA could be excellent or terrible depending on how many demos become qualified opportunities and customers. For a SaaS business, the safest approach is to track the CPA at each important funnel stage and connect those figures using your real conversion rates.
Growth vs profitability: how to calculate target CPA
Following on from the example above, we calculated a break-even max CPA of $4,000. In theory, you could spend anything below that amount to acquire a customer and avoid making a direct loss. In practice, spending $3,999 to acquire a customer worth $4,000 after costs would leave you with a profit of one dollar, which probably isn’t the business model you had in mind.
Your target CPA needs to account for the profit you want to retain:
Target CPA = CLV − lifetime customer costs − required profit per customer
If CLV is $5,000, lifetime customer costs are $1,000 and you want to retain $2,000 in profit, your target CPA would be $2,000. You may also need to account separately for agency fees or other acquisition costs if they haven’t already been included.
The right target CPA depends on your growth strategy. A lower target protects more margin but may restrict the number of conversions you can reach. A higher target gives you more room to compete and scale, but leaves less profit behind. The important calculation is finding the tipping point where additional conversions at a higher CPA begin to reduce total profit rather than increase it.

The graph above highlights this point. In this particular example, conversion volume continues to increase as CPA rises, but net profit begins to decline once CPA exceeds $95. That doesn’t mean $95 is a universal limit. It is simply the tipping point created by the revenue, churn, conversion rates and costs used in this model.
Here is the data set used to calculate it.

- Avg Monthly $ = The average monthly revenue per client.
- Lead > Client % = The conversion rate from the initial conversion to becoming a paid client. For example, the percentage of free trial users who become paying clients.
- Churn % = The average percentage of clients who cancel each month.
- Fixed cost = The share of overheads you choose to allocate to each client, such as software, office costs or finance support.
- Cost per client = The average cost incurred over the lifetime of each client relationship.
- Agency fee = You can remove this if you manage campaigns in-house. In this example, agency fees are set at 15% of spend or $1,000, whichever is higher.
- Net = Your profit after ad spend, agency fees, fixed costs and other included expenses.
If you’d like a copy of the spreadsheet, get in touch and we’ll send it over. You can use it to experiment with your own numbers, keeping fixed costs as a separate field or building them into your cost per client. The important thing is to include each cost once and apply the same approach consistently.
Putting it into practice: what is a good CPA in marketing?
If you’ve taken the time to work through the calculations above, you may now be wondering how you can predict the volume of conversions available at each CPA. That’s a fair question, and unfortunately there isn’t a neat universal answer.
A good CPA is one that stays within your unit economics while delivering the customer quality and volume the business needs. It will vary by industry, market, channel, product, sales model and funnel stage. Attorney and mortgage-related keywords, for example, can have incredibly high CPCs and subsequently high CPAs. Ultimately, the market plays a large role in setting the price.
Industry benchmarks can give you a rough starting point, but take them with a pinch of salt. LocaliQ’s 2026 search advertising benchmarks put the average cost per lead at $66.69 across the industries studied and $93.69 for Business Services. Those are cost-per-lead figures from US search campaigns, not the average cost of acquiring a paying SaaS customer, so they shouldn’t be treated as ready-made CPA targets.
Your own CLV, margins and funnel conversion rates are much more useful. A $300 CPA could be unaffordable for one company and extremely profitable for another. It also matters what the conversion represents. Paying $300 for a customer is very different from paying $300 for a content download that may never progress any further.
The only reliable way to understand the CPA and conversion volume available in your market is through real-world testing. If you’re just starting out in PPC, realise that it can take weeks or even months to find the sweet spot. Understand your max CPA first, set a sensible target, and then test different campaigns and channels against it.
Google Ads cost per acquisition may vary greatly from LinkedIn, and brand campaigns will usually behave differently from non-brand activity. Keep their goals and KPIs separate so cheap branded conversions don’t hide what it really costs to generate new demand. Once you collect enough data, you’ll have meaningful numbers of your own to benchmark.
When to use a PPC agency for CPA management
Calculating CPA is one thing. Managing an account against it is another. A lower platform CPA isn’t automatically a win if the campaigns are generating poor-quality leads that never become customers.
A PPC agency should help you connect campaign costs to lead quality, pipeline and revenue, rather than stopping at the conversion figures reported by Google Ads or LinkedIn. For a SaaS company, that means separating demo or free trial CPA from customer CPA, feeding downstream conversion data back into the ad platforms, and making budget decisions against both target CPA and max CPA.
It also means looking beyond bids and keywords. If CPA is increasing, the constraint may be in the targeting, offer, tracking, landing page or sales handover. A specialist SaaS PPC agency should help you find where the economics are breaking down and decide what to test next, rather than simply chasing a cheaper number inside the platform.
Summary
Cost per acquisition is one of the most useful PPC metrics when it’s connected to customer value and profit. Calculate your actual CPA, max CPA and target CPA separately, then use your funnel conversion rates to work backwards from paying customers to free trials, leads and other conversion actions.
If you read this far and followed along, well done. The hard part is putting it into practice. It can be especially difficult if you’re an agency like us and you’re relying on clients to provide the numbers. Don’t give up. Push for them. In the end, they’ll thank you for it.