Evaluating Creative Tests in SaaS Paid Social: Beyond Vanity Metrics
How to evaluate SaaS paid social creative tests using pipeline indicators, audience learning, and next-action quality instead of vanity metrics.

You ran the creative test. The new hook lifted click-through rate by 40%. Engagement is up, the dashboard looks healthy, and the variant is winning on every number the ad platform hands you. Then your VP asks the only question that matters: did it produce pipeline? And you do not have an answer.
That gap sits at the centre of most creative reporting for SaaS paid social. Teams measure what the platform gives them for free, clicks, impressions, engagement rate, and call it performance. Those numbers are easy to collect and easy to celebrate. They also tell you almost nothing about whether a creative test moved the business.
The fix is not more data. It is better questions. Evaluating creative tests without leaning on vanity metrics means judging each variant against pipeline indicators, audience learning, and the quality of the next action it produces. That shift is what separates a creative programme that compounds from one that just keeps the dashboard green.
It matters more now than it did two years ago. Refine Labs' 2025 attribution study found a roughly 90% gap between what software-based tracking reports and what buyers actually say influenced them, with entire channels like podcasts and dark social under-reported or missed entirely. If your tracking is that blind to how demand forms, judging a creative test on platform metrics alone is measuring the wrong thing with confidence.
What creative reporting without vanity metrics actually means
Creative reporting for SaaS paid social without vanity metrics is the practice of evaluating each ad variant by its contribution to qualified pipeline and revenue, plus what it taught you about the audience, rather than by surface engagement.
A vanity metric is any number that moves independently of business outcomes. CTR, impressions, likes, and video views all qualify. They are inputs and guardrails, useful for spotting a broken ad, useless for deciding which creative deserves more budget.
To report on a creative test the way it deserves, work through four questions in order:
- Which variant produced the most qualified pipeline, not the most clicks?
- What did the result teach you about the audience, message, or offer?
- What is the quality of the next action each variant drove, demo requests versus content downloads sales will never touch?
- What changes as a result, and what happens next?
If your current report answers only the first half of question one, it is a vanity report wearing a suit.
Why vanity metrics mislead creative decisions
Measuring performance in B2B social media campaigns is harder than in most verticals, and vanity metrics exploit exactly that difficulty. SaaS deals involve buying committees, run for weeks or months, and rarely convert on the click that a platform can see. A creative that wins on engagement can still feed sales a list of leads they will not touch.
The most common failure is conflating engagement with revenue impact. A punchy, provocative hook often earns the highest CTR and the lowest lead quality, because it pulls in curiosity clicks from people outside your ICP. Judge that creative on clicks and you scale it. Judge it on MQL-to-SQL conversion and you kill it.
Context is the other missing piece. A variant with a lower CTR but a higher share of leads from target accounts is the better creative, full stop. Numbers without context, which segment, which stage, which offer, are just noise arranged neatly. Reading platform data literally, without the CRM alongside it, is how teams optimise their way into a pipeline drought.
This is also where creative reporting quietly differentiates a team. Anyone can screenshot a rising engagement chart. Connecting a specific creative variant to sales-qualified pipeline is the reporting that survives a board meeting.
The three lenses for evaluating a creative test
Strong creative reporting looks at every test through three lenses. Skip any one of them and you get a partial verdict.
Pipeline indicators
Pipeline indicators are the metrics that track a creative test through to revenue, not the click. The ones worth reporting on per variant:
- Cost per opportunity, not just cost per lead. A cheap lead that never becomes an opportunity is expensive.
- MQL-to-SQL conversion rate, segmented by creative. This is the single clearest signal of lead quality.
- Sales-qualified pipeline generated, attributed to the variant through CRM integration.
- Pipeline velocity, whether leads from a variant close faster or stall.
2026 benchmarks give you something to grade against. SaaS Hero reports LinkedIn MQL-to-SQL rates of 15 to 25% as a healthy band and cost per SQL as the metric that should drive creative decisions. A variant sitting well below that range is failing regardless of how its CTR looks.
Audience learning
Every creative test is also an audience experiment. The result tells you something about which message, pain point, or framing resonates with which segment, and that learning often outlasts the specific ad.
When a problem-led hook outperforms a feature-led one for mid-market accounts but not enterprise, that is a reusable insight about how each segment thinks. Report it. Audience learning is the compounding asset in a creative programme: the individual ad expires, the understanding of what your ICP responds to does not.
Next-action quality
The last lens is what happens immediately after the click. Two variants can drive identical volumes of conversions while producing completely different next actions.
A creative that sends people to a high-intent demo request behaves differently from one that drives a top-of-funnel content download. Neither is wrong, but they are not comparable on a single conversion count. Reporting next-action quality means grading the destination and intent of each conversion, then judging the creative against the action you actually wanted it to produce.
Meaningful metrics for SaaS marketing success
Meaningful metrics for SaaS marketing success are the ones a revenue leader recognises without translation. Use this as the reporting checklist for any creative test, replacing the platform defaults:
- Cost per opportunity by variant
- MQL-to-SQL conversion rate by variant
- Sales-qualified pipeline generated
- Share of leads from target accounts or ICP fit
- Pipeline velocity for leads sourced by each creative
- CAC payback contribution where the sales cycle allows attribution
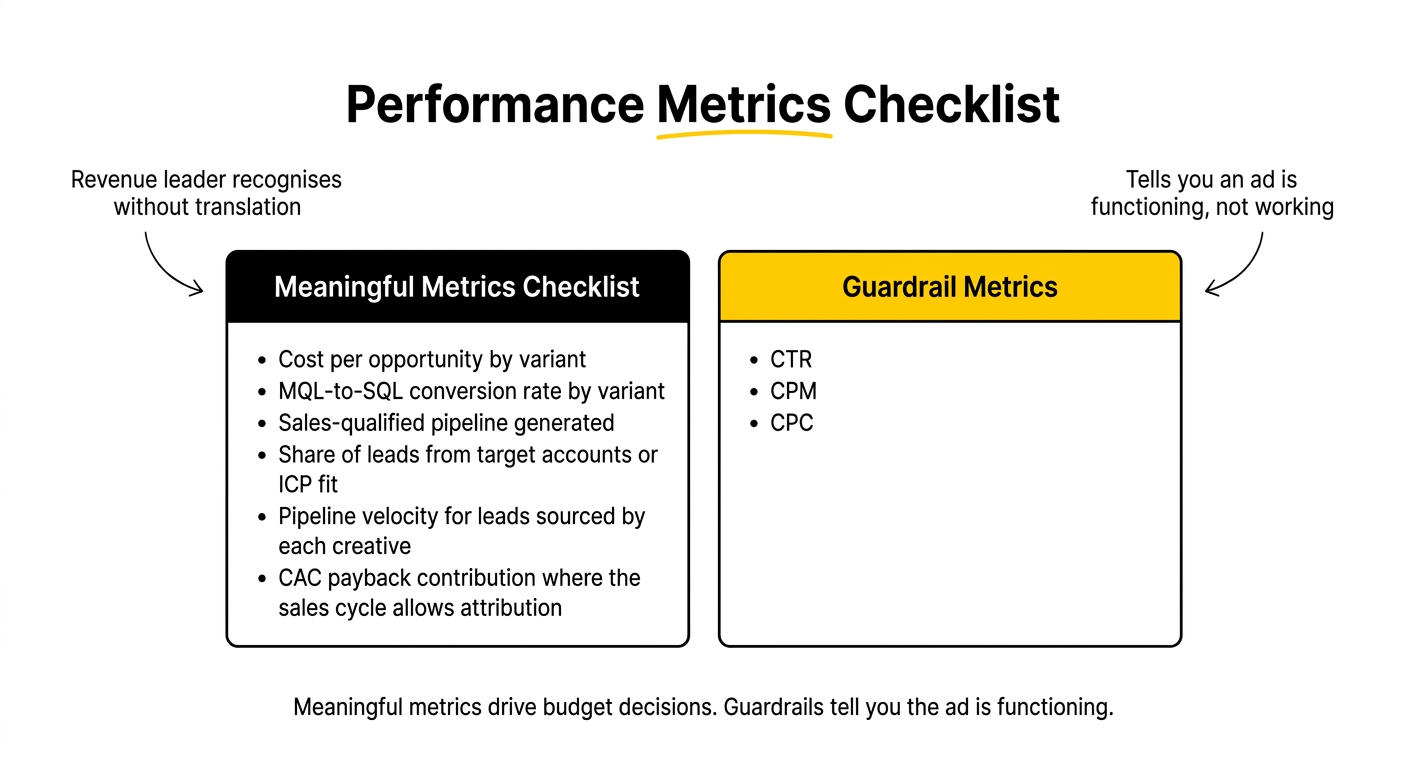
Keep CTR, CPM, and CPC on the report, but label them clearly as guardrails. They tell you an ad is functioning, not that it is working. The moment a guardrail metric starts driving budget decisions, it has become a vanity metric.
For a fuller treatment of SaaS measurement infrastructure, the tracking and attribution setup that makes any of this possible, see our saas analytics hub.
A worked example: reading one creative test
Consider a Series B security platform running two LinkedIn variants for a demo offer.
Variant A uses a bold, contrarian hook. It pulls a 0.71% CTR, well above the LinkedIn benchmark, and the lowest cost per lead in the account. On a vanity report, it wins outright.
Variant B uses a specific, problem-led hook aimed at security engineers. Its CTR is 0.42%, below A, and its cost per lead is higher.
Run both through the three lenses and the verdict flips. Variant A's MQL-to-SQL rate lands at 9%, below the healthy band, because the provocative hook attracted curiosity clicks from outside the ICP. Variant B converts at 21%, sends a higher share of leads from target accounts, and those opportunities move through pipeline faster. Variant B produced less noise and more revenue.
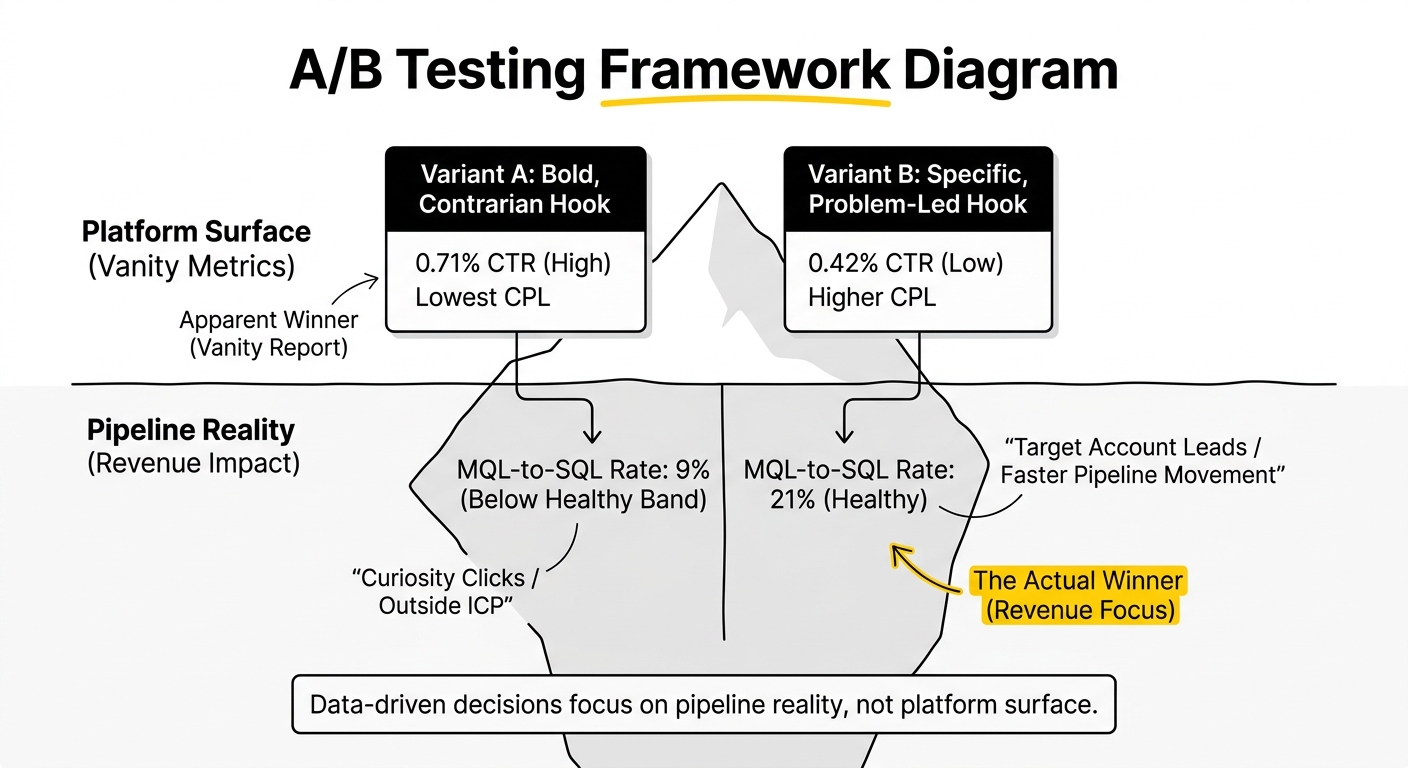
That is a data-driven decision made from pipeline reality, not platform surface. The vanity report would have scaled the wrong ad and starved the right one. The structure for designing tests like this so the comparison is clean in the first place is its own discipline, which we cover in Creative Testing Frameworks for B2B SaaS Paid Social.
Transparent reporting: what changed, why, and what happens next
The reporting format matters as much as the metrics. Stakeholders do not need a data dump. They need a decision narrative built on three parts:
- What changed. The result, stated in pipeline terms. “Variant B generated 2.3x the qualified pipeline of Variant A at a 12% higher cost per lead.”
- Why it changed. The audience learning behind the result. “The problem-led hook filtered for in-market security engineers rather than broad curiosity.”
- What happens next. The decision and the next test. “Scaling B, retiring A, and testing a second problem-led angle against a new segment.”
This is where creative reporting earns trust. A report that only shows numbers invites second-guessing. A report that explains the reasoning and names the next move demonstrates that the programme is being steered, not just observed. That is the difference between a marketer who reports to stakeholders and one who is trusted to make the call.
Keep this distinct from broader campaign reporting to leadership, which covers the full pipeline picture across channels. Here the unit of analysis is the creative test itself: what one variant taught you and what you did about it.
Closing the loop: from result to the next test
A single creative test is a data point. A feedback loop is a system. The teams that improve fastest treat every result as an input to the next hypothesis, so audience learning accumulates instead of resetting each sprint.
The loop runs in four stages: run a disciplined test, evaluate it through the three lenses, feed the audience insight into a new hypothesis, then test again. SaaS Hero's 2026 testing guidance suggests running tests for roughly 7 to 14 days or 100-plus conversions before calling a result, enough signal to trust the pipeline read rather than the early click spike.
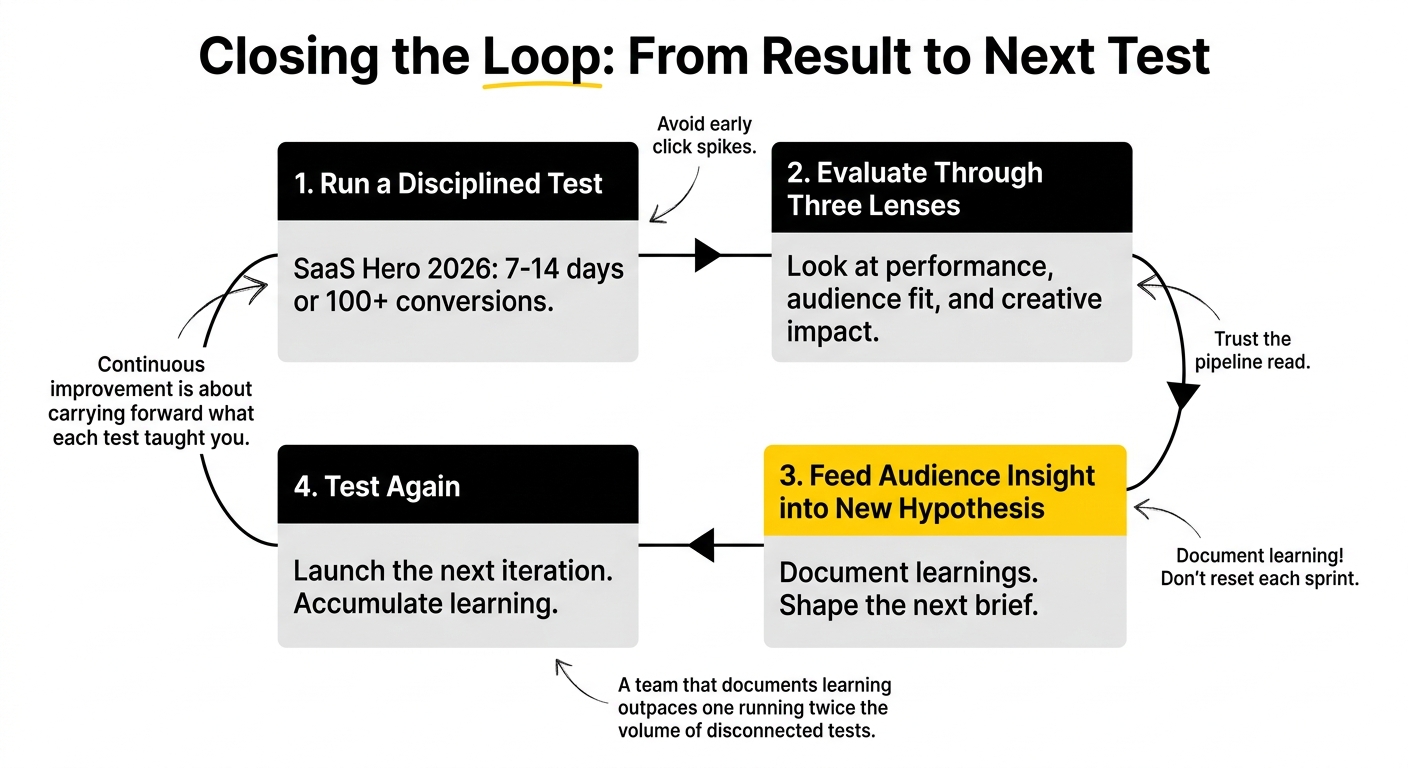
Continuous improvement in SaaS paid social is not about testing more creatives. It is about carrying forward what each test taught you. A team that documents audience learning and lets it shape the next brief will outpace one running twice the volume of disconnected tests.
Common pitfalls to avoid
A few failure patterns show up again and again in creative reporting:
- Calling tests too early. Reacting to a day-two CTR spike before pipeline data exists.
- Conflating engagement with revenue. The single most expensive habit in the list.
- Reporting metrics without context. A number with no segment or stage attached cannot support a decision.
- Ignoring next-action quality. Treating a content download and a demo request as the same conversion.
- Letting guardrail metrics drive budget. The moment CTR decides spend, it is a vanity metric again.
If you are working through how to rebuild your creative reporting around pipeline rather than platform metrics, this is the kind of thing we dig into with SaaS teams regularly. Worth a conversation if you are at that point.
Frequently Asked Questions
What are the key performance indicators for evaluating creative tests in SaaS paid social campaigns?
The KPIs that matter are pipeline indicators: cost per opportunity, MQL-to-SQL conversion rate, sales-qualified pipeline generated, share of leads from target accounts, and pipeline velocity. These connect a creative variant to revenue. Platform metrics like CTR and CPM stay on the report as guardrails to confirm an ad is functioning, but they should never drive which creative gets more budget.
How can marketers shift their focus from vanity metrics to pipeline indicators in social media?
Start by connecting your ad platform to your CRM so each creative variant can be tracked through to opportunity and closed-won revenue. Relabel CTR, impressions, and engagement as guardrails rather than performance metrics. Then rebuild every creative report around one question: how much qualified pipeline did this variant produce? The shift is as much about reporting structure as tooling.
What strategies can B2B marketers use to assess the quality of leads generated from paid social campaigns?
Segment lead quality by creative variant and measure MQL-to-SQL conversion, share of leads matching your ICP, and how quickly those leads move through pipeline. A healthy LinkedIn MQL-to-SQL rate sits around 15 to 25% in 2026 benchmarks. Variants pulling high volumes of leads that sales will not touch are failing, regardless of how cheap or clickable they look.
How can transparent reporting improve decision-making in SaaS paid social marketing?
Transparent reporting replaces a data dump with a decision narrative: what changed, why it changed, and what happens next. Stating results in pipeline terms and explaining the audience learning behind them builds stakeholder trust and speeds up decisions. It also surfaces the reasoning, so a losing test still produces a usable insight rather than just a red number on a dashboard.
What are actionable metrics, and why are they important for performance-driven marketing?
Actionable metrics are numbers that directly inform a decision, cost per opportunity tells you which creative to scale, MQL-to-SQL rate tells you which to cut. Vanity metrics like impressions move without changing what you do. For performance-driven marketing, actionable metrics matter because they close the gap between measurement and action, turning a report into a set of decisions rather than a status update.
How can audience learning impact the effectiveness of creative testing in social media?
Every creative test is also an audience experiment. When one message or framing outperforms another for a specific segment, that insight is reusable long after the ad retires. Documenting audience learning and feeding it into the next hypothesis is how a creative programme compounds. The individual ad expires; the understanding of what your ICP responds to keeps paying off.
What steps should marketers take after analysing the results of creative tests in paid social?
Run the result through three lenses: pipeline contribution, audience learning, and next-action quality. Decide which variant to scale and which to retire based on qualified pipeline, not clicks. Document what the test taught you about the audience, then convert that insight into the next hypothesis. Finally, report the decision and the next test, not just the numbers.
How can continuous improvement be fostered in SaaS paid social campaigns?
Treat every test result as an input to the next one. Build a loop: run a disciplined test, evaluate it through pipeline and audience lenses, feed the learning into a new hypothesis, then test again. Continuous improvement comes from carrying insights forward, not from running more disconnected tests. A team that documents learning will outpace one running double the volume without a memory.
What are common pitfalls to avoid when measuring success in social media marketing?
The frequent mistakes: calling tests too early on click spikes before pipeline data exists, conflating engagement with revenue, reporting metrics without segment or stage context, ignoring the quality of the next action a creative drives, and letting guardrail metrics like CTR dictate budget. Each one leads to scaling the wrong creative and starving the one that actually produces pipeline.
How can B2B marketers effectively communicate the results of their creative tests to stakeholders?
Lead with pipeline, not platform metrics. Use a three-part structure: what changed stated in revenue terms, why it changed based on audience learning, and what happens next as a concrete decision. Emphasise quality leads over clicks. A report that names the reasoning and the next move demonstrates the programme is being steered, which builds far more trust than a wall of engagement charts.