Crafting an Effective Tracking Plan for PLG and Sales-Led SaaS
Design a tracking plan that works for both PLG and sales-led SaaS. Learn to solve data silos, improve attribution accuracy, and unify reporting across your martech stack.

You've built a strong product. Users are coming through the door. But as your marketing and product teams pull data from different places, they're asking very different questions.
The product team is watching activation rates and time-to-value. The sales team is counting SQLs and measuring deal velocity. Both are right, but neither sees the full picture. Without a unified tracking plan, you end up with conflicting metrics, manual report consolidation, and no clear answer to the simplest question: which growth motion is actually working.
The challenge isn't complexity. It's fragmentation.
A SaaS company pursuing product-led growth (PLG) measures success through product engagement and user behaviour. A company running sales-led growth (SLG) measures success through sales pipeline and deal closure. And if you're doing both, you need a tracking plan that honours both motions without turning your martech stack into a data nightmare.
Why PLG and Sales-Led SaaS Need Different Tracking Plans
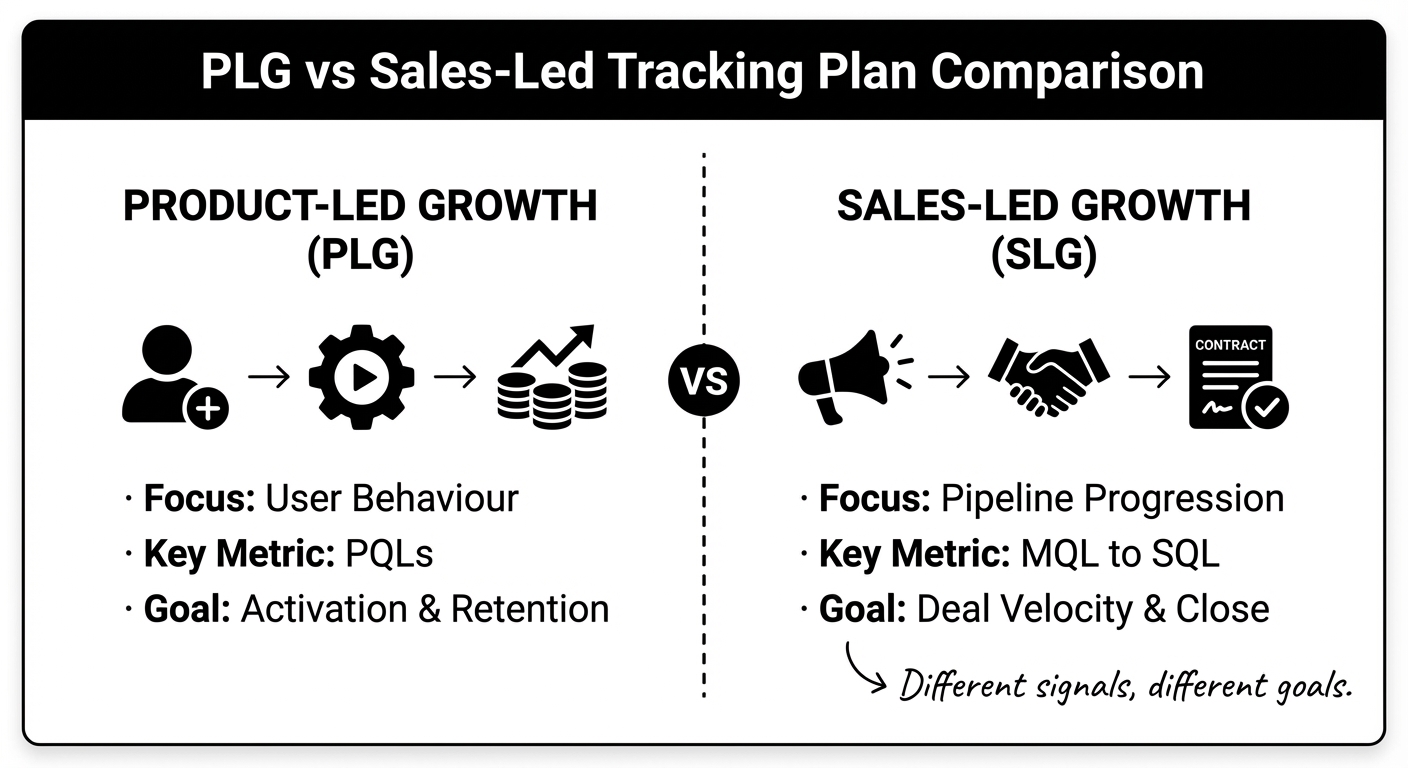
The fundamental difference between PLG and sales-led growth is where value is proven. In PLG, the product proves its own value. In sales-led SaaS, a sales representative does.
This difference cascades through your entire measurement framework.
PLG relies on product usage signals. A user who completes key actions within your product, reaches an aha moment, and demonstrates intent to upgrade is what we call a product-qualified lead (PQL). That PQL is your signal that something is working. Your tracking plan captures every step toward that activation event.
Sales-led SaaS, by contrast, relies on lead quality and sales momentum. A marketing-qualified lead (MQL) moves to a sales-qualified lead (SQL) based on sales engagement and discovery conversation, not product behaviour. Your tracking plan measures how many prospects enter the sales funnel, how far they progress through stages, and what deal characteristics predict a close.
The same customer journey produces very different KPIs depending on your go-to-market motion. For a PLG company, churn is an existential metric. For a sales-led company, sales cycle length is. Neither metric is "wrong" for the other model, but neither tells the full story if you're not tracking the right thing.
Understanding the Tracking Requirements for Product-Led Growth
A successful PLG tracking plan answers a single question: how fast do free or trial users reach a moment where they're ready to pay?
Product-qualified leads (PQLs) are the north star. But there's no universal PQL definition. One analytics company might define a PQL as a user who has created two projects and invited a team member. Another might set the bar at feature usage over five consecutive days. Your job is to determine what actions genuinely predict conversion and retention at your company.
Identify your PQL by working backwards from your best customers. Which early actions did they take in your product? Which features did they use? What pace of engagement preceded their upgrade? Use session recordings, cohort analysis, and customer interviews to build a reliable signal.
Once you've defined your PQL, your tracking plan should measure the full path to activation.
Activation rate measures the percentage of free or trial users who reach your aha moment. If 15% of signups reach your PQL threshold within 30 days, that's your baseline. Your job is to improve it.
Time-to-value (TTV) measures how long it takes for a user to experience enough value in your product to justify staying or paying. Faster TTV means faster conversion. If your median TTV is 14 days, and a competitor's is 7, you're already behind in the onboarding conversation.
Feature adoption tells you which parts of your product create stickiness. Tracking this per feature helps you prioritise roadmap decisions and onboarding messaging. If 40% of users adopt feature A but only 12% adopt feature B, you know where to focus.
Retention and churn are where PLG economics live. A product-led company with healthy unit economics has users who stick around and expand. Your tracking plan should measure monthly retention by cohort, so you can spot which user segments stay longest and which churn fastest. Churn below 5% monthly is healthy; above 10% signals a problem.
Expansion revenue and net revenue retention (NRR) measure whether existing customers buy more. For a PLG company, expansion often comes through upgrades and add-on purchases, not sales conversations. Tracking which customer cohorts expand and at what rate tells you whether your monetisation model is working.
Most successful PLG companies track these metrics through a product analytics platform, feeding product events into their martech stack in real time. That means every user action is an event: sign-up, login, feature used, upgrade triggered. String those events together, and you get a complete view of the user journey from awareness to expansion.
Understanding the Tracking Requirements for Sales-Led SaaS
A successful sales-led tracking plan answers a different question: how many qualified prospects can our sales team convert into pipeline and revenue?
Marketing-qualified leads (MQLs) are your starting point. An MQL is a prospect who has shown enough early interest that the sales team will take a meeting. That might be a whitepaper download, a webinar attendance, or a demo request. The threshold varies by company, but the goal is consistent: surface enough viable prospects that your sales team can work effectively.
MQL-to-SQL conversion rate measures the percentage of marketing-qualified leads that sales accepts and qualifies as SQLs. If your MQL-to-SQL ratio is 30%, that means one in three MQLs survive initial sales scrutiny. This metric drives the entire demand gen conversation: are we sending sales the right people, or are we chasing quantity over quality?
Sales cycle length is how long deals take from first meeting to close. A six-month enterprise deal is normal. A 90-day SMB deal suggests a healthy process. Tracking this by deal size and customer segment helps you forecast pipeline and identify bottlenecks.
Deal velocity measures how fast opportunities progress through your sales stages. If the average SQL spends three months stuck at "needs approval", you've found a bottleneck worth investigating.
Customer acquisition cost (CAC) measures how much you're spending in sales and marketing to acquire each paying customer. For a sales-led company, CAC is typically high because humans are expensive. Your job is to improve the ratio of CAC to customer lifetime value (LTV). A healthy LTV:CAC ratio is 3:1 or better.
Win rate by stage and sales rep tells you where deals are actually lost. Are you losing deals at the discovery stage, or at the buying committee stage? Which reps close at higher rates? This intelligence drives coaching and process improvement.
For sales-led companies, these metrics typically flow from a CRM (HubSpot, Salesforce, Pipedrive) integrated with marketing automation and analytics tools. Every pipeline movement is tracked as a stage change. Every touchpoint from marketing is mapped to the deal that it influenced.
Building a Unified Tracking Framework for Hybrid Growth
Most sophisticated SaaS companies aren't purely PLG or purely sales-led anymore. You're doing both.
Maybe you land with a free trial and let users self-serve, but you inject sales conversations when a user crosses into the enterprise segment. Or you run inbound demand generation alongside an outbound sales team. Either way, you need a tracking plan that serves both motions without forcing one to compromise.
A unified framework starts with a shared definition of success. For your company in 2026, that might be: monthly recurring revenue growth driven by both high-volume, low-touch acquisition (PLG) and high-value, high-touch deals (sales-led).
From there, build separate KPI stacks for each motion, then identify the intersection points where they meet.
For PLG, your KPIs remain usage-driven: PQLs, activation rate, time-to-value, retention, expansion revenue.
For sales-led, your KPIs remain pipeline-driven: MQL-to-SQL, deal velocity, CAC, win rate.
But here's the critical link: a PQL who is also an SQL is a warmer lead. A usage signal combined with a buying signal is stronger than either alone. Your tracking plan should capture when these moments happen and how they affect conversion.
Segment your reporting by go-to-market motion. Show product leaders the metrics that drive PLG adoption. Show revenue leaders the metrics that drive sales outcomes. But also create a unified dashboard that shows how the two motions intersect: which PQLs become SQLs, how usage signals predict deal closure, and whether customers who engage with product early stay longer.
This requires intentional data flow. Your product analytics platform must feed events to your CRM. Your marketing automation must surface usage data to the sales team. Your attribution model must be flexible enough to credit both product engagement and sales activity when both have occurred.
Solving Data Silos and Attribution Challenges
Here's the reality: 65.7% of B2B organisations cite data integration as their biggest martech stack challenge. Your tools don't talk to each other by default. Building that conversation requires deliberate architecture.
Data silos happen because your product analytics lives in one tool, your CRM in another, your email platform in a third, and your ad platforms scatter across Meta, Google, and LinkedIn. Each platform speaks its own data language. Your user IDs don't match. Your timestamps don't align. Your event names contradict each other.
The cost of this fragmentation is real. Teams spend hours manually consolidating reports, wondering why the numbers don't match between systems. Sales questions the lead quality that marketing claims to have generated. Marketing questions whether leads actually became revenue. No one has confidence in the numbers.
The fix is a deliberate data integration strategy.
Start by selecting an attribution hub. This is not your CRM and not your analytics tool. It's a purpose-built platform designed to connect everything and translate between systems. An attribution hub sits between your ad platforms, your product analytics, your CRM, and your marketing automation, pulling data from each in real time and normalizing it into a consistent view.
Once you've chosen your hub, wire it to your critical data sources. Your product analytics platform should push PQL events to your attribution hub, which then pushes them to your CRM so sales knows which free users are worth calling. Your ad platforms should report conversions back through your attribution hub, so the CRM knows which campaigns actually contributed to deals. Your email platform should log engagement to the hub, so you're tracking a complete picture of what drove each customer.
The goal is single source of truth. Not three reports that might be right. One dashboard that both marketing and sales trust.
This requires governance. Decide which system owns each data point. If the CRM is the source of truth for lead status, the attribution hub reads from the CRM and doesn't overwrite it. If product analytics owns activation events, the hub pulls those and doesn't argue about them. Clear ownership prevents conflicts.
Most teams also need to implement server-side tracking. Browser cookies are less reliable than they used to be. iOS privacy features block pixels. Ad blockers prevent firing. Server-side tracking sends data directly from your backend to your tracking platforms, bypassing the browser entirely. This is how you maintain signal integrity across devices and ensure you're not losing data.
.jpeg)
Integrating Your MarTech Stack for Seamless Tracking
A well-integrated martech stack doesn't just track better. It runs better.
Start with your core four. You need a CRM (HubSpot, Salesforce, or Pipedrive). You need product analytics (Amplitude, Mixpanel, or similar). You need marketing automation (HubSpot, Marketo, or Braze). And you need an attribution or analytics layer that ties it all together.
For most mid-market SaaS companies, this is HubSpot for CRM and marketing automation, a dedicated product analytics tool for usage events, and an attribution platform like Segment or a custom integration layer that routes data bidirectionally.
From there, connect in this sequence:
Product analytics to CRM: When a user becomes a PQL, that event should flow to the CRM as a property on the contact record. A sales rep should never have to leave the CRM to know whether a free trial user has hit your activation threshold.
CRM to ad platforms: When a lead converts, close the loop back to Meta and Google Ads so they know this MQL became a customer. This trains your ad platforms to find more people like your customers.
Email platform to attribution: Every email send and click should be logged as an event that your attribution hub can see. This ensures nurture campaigns are credited in multi-touch attribution.
Attribution hub to reporting dashboard: Pull data from your hub into a business intelligence tool (Looker, Tableau, or a custom dashboard in Data Studio) that both marketing and sales can access. This becomes the source of truth. Structuring SaaS PPC Accounts for PLG vs Sales-Led Funnels, also on this blog, takes this further.
Most teams take 90 days to build this end-to-end. The first 30 days are mapping and planning. The second 30 days are implementing integrations and testing. The third 30 days are validating data accuracy and rolling out dashboards to teams.
Don't try to do everything at once. Start with the path from product analytics to CRM. Get that working. Then add attribution. Then add closed-loop reporting to your ad platforms. Each step reduces silos and increases confidence in your data.
.jpeg)
Frequently Asked Questions
What key performance indicators (KPIs) should be included in a tracking plan for Product-Led Growth (PLG) SaaS?
Product-qualified leads (PQLs), activation rate, time-to-value, monthly retention, churn rate, and expansion revenue. These metrics measure how effectively your product drives adoption, prevents churn, and generates revenue without sales intervention.
How do the tracking requirements differ between Product-Led Growth (PLG) and Sales-Led SaaS models?
PLG tracking focuses on product engagement signals and user behaviour: activation, retention, and expansion. Sales-led tracking focuses on pipeline progression: MQL-to-SQL conversion, deal velocity, and CAC. PLG measures whether the product sells itself. Sales-led measures whether the sales team converts efficiently.
What are the best practices for designing a tracking plan that aligns with a go-to-market strategy?
Define your success metrics clearly before building your tech stack. Align product, marketing, and sales on shared definitions of leads and customers. Map how your go-to-market motion flows through your systems. Test your data flow end-to-end. Most teams need 90 days to mature a tracking plan from design to reliable reporting.
How can marketing operations specialists ensure accurate attribution in their tracking plans?
Implement server-side tracking to avoid pixel loss. Build a unified data hub that normalises events across platforms. Establish clear ownership of each data point so there's no conflict between systems. Regularly audit your integrations to catch breakage before it affects reporting.
For a detailed step-by-step approach to this audit process, see A 30-Day Guide to Auditing Your SaaS PPC Analytics Stack.
What challenges do organisations face with siloed data in tracking for PLG and Sales-Led SaaS?
Data lives in different systems with different user IDs, timestamps, and event naming conventions. Teams spend hours reconciling conflicting numbers. Sales questions marketing's lead quality. Marketing can't prove which campaigns drove deals. The cost is both operational and strategic: decisions are based on incomplete data.
What solutions can enhance data integrity and operational efficiency in tracking plans?
Select an attribution hub that connects your key systems. Implement bidirectional data flow so each system talks to every other. Use server-side tracking to avoid signal loss. Create a unified dashboard that both marketing and sales trust. Assign clear data ownership so systems don't conflict.
How can existing MarTech stacks be integrated into a tracking plan for SaaS models?
Start with your core four: CRM, product analytics, marketing automation, and attribution. Build integrations in sequence: product analytics to CRM first, then ad platforms, then email, then reporting. Test each connection before moving to the next. Most teams complete end-to-end integration in 90 days.
What metrics should be prioritised for measuring success in a PLG strategy?
Prioritise the metrics that predict long-term retention and revenue: activation rate and time-to-value early on, then monthly retention and churn as customers mature. Expansion revenue becomes critical once you have enough paying customers to measure it reliably. These metrics are forward-looking and actionable.
How can manual report consolidation be minimised in tracking for SaaS?
Build automated data flow from your systems into a unified reporting dashboard. Use your attribution hub to normalise data so it doesn't need manual reconciliation. Schedule regular audits to catch integration breaks before they create manual work. As your integrations mature, you should need no manual reporting.
What role does customer feedback play in refining tracking plans for PLG and Sales-Led SaaS?
Customer feedback reveals what your metrics are missing. Ask customers who churned why they left. Ask customers who expanded why they paid more. Ask your sales team which leads actually become revenue. Feed those insights back into your KPI definitions and your activation events so your metrics stay aligned with reality.