Diagnosing Customer Acquisition Cost Issues Using Lead-to-Customer Conversion Rates
Learn to diagnose CAC issues by analysing lead-to-customer conversion rates and identifying bottlenecks in your sales funnel.

Your CAC is climbing. You check the obvious suspects: click costs are steady, impression share is holding, spend is on plan. But the number keeps moving in the wrong direction. The problem almost certainly lives downstream, not in the media budget.
Most CAC investigations stop at the top of the funnel. Teams look at Cost Per Click, adjust bids, reshuffle budgets between campaigns, and wait to see if the number improves. When it doesn’t, the cycle repeats. What gets missed is that customer acquisition cost is a compound metric. It multiplies together your cost to acquire a click, your ability to convert that click into a lead, and your ability to convert that lead into a customer. A problem at any one of those stages inflates the final number, and the symptoms look identical from the outside.
Diagnosing customer acquisition cost issues properly means disaggregating that compound figure into its component parts and testing each one in sequence. Lead-to-customer conversion rate analysis is the most productive place to start, because it is the stage where most SaaS teams lose the most value and receive the least scrutiny.
Breaking Down the CAC Formula
The CAC formula is straightforward: total acquisition spend divided by the number of new customers acquired in the same period. That ratio, on its own, tells you almost nothing about where the problem is.
More useful is the expanded form:
CAC = Cost Per Click / (Conversion Rate x Win Rate)
This version makes the levers visible. Cost Per Click (CPC) is largely determined by the competitive auction. Conversion rate (CVR) reflects how well your landing pages and lead capture convert traffic into leads. Win rate, sometimes called close rate, reflects how many of those leads your sales team converts into paying customers. A rising CAC could mean CPC is up, CVR is down, win rate has dropped, or some combination of all three.
Most teams monitor CPC carefully because it is reported directly in the ad platform. CVR is watched on the landing page. Win rate, however, is often only tracked inside the CRM, if it is tracked at all. The stage in between, the full lead-to-customer conversion journey, is where attribution gaps accumulate and where the real CAC diagnosis work happens.
What Lead-to-Customer Conversion Rate Analysis Actually Tells You
Lead-to-customer conversion rate is the aggregate rate at which a raw lead becomes a closed-won customer. It is the product of every handoff in your funnel: lead to MQL, MQL to SQL, SQL to opportunity, opportunity to close.
For B2B SaaS companies in the SMB to mid-market range, the compounded lead-to-customer rate typically lands around 2, 3% when all funnel stages are included. That means for every 100 leads generated, roughly two or three become customers. The number itself is less important than understanding where in that sequence the attrition is highest.
The diagnostic value of this metric is not in the aggregate figure. It is in the stage-by-stage comparison. When you break down where leads are lost, one of three patterns typically emerges.
Pattern one: attrition at the MQL-to-SQL stage. This is the most common bottleneck in B2B SaaS. According to Varos 2026 data, a healthy MQL-to-SQL rate for SaaS sits between 25% and 40%. Rates consistently below 15% point to one of two problems: either marketing is generating leads that do not match the ICP, or the scoring criteria being used to pass leads to sales are too loose. Both inflate CAC. In the first case, you are paying to acquire people who will never buy. In the second, you are burning sales capacity on unqualified conversations.
Pattern two: attrition at the SQL-to-opportunity stage. If the MQL-to-SQL conversion is healthy but opportunities are not being created from those SQLs, the problem is usually in the discovery and qualification process. Sales teams not qualifying effectively, or leads arriving with mismatched expectations about pricing, timeline, or use case, stall at this stage. Improving the quality of information that accompanies a lead when it passes to sales, including intent signals, page history, and content consumed, reduces this attrition meaningfully.
Pattern three: attrition at opportunity-to-close. A strong top and mid funnel that loses deals at the bottom almost always points to competitive positioning or commercial friction. Discount rates, procurement complexity, and multi-stakeholder buying committees tend to show up here. If this is the bottleneck, the CAC problem is not a marketing operations issue. It needs to be addressed with sales enablement and pricing strategy.

Differentiating Lead Quality from Conversion Efficiency
One of the most important distinctions in improving lead conversion for better CAC is separating lead quality from conversion efficiency. They require different fixes.
Lead quality is determined before the lead enters your funnel. It reflects whether your targeting, your ad creative, your landing page messaging, and your traffic sources are reaching and attracting the right people. If your ICP is a head of engineering at a 200-person SaaS company and your keyword strategy is pulling in freelancers and students, no amount of optimisation further down the funnel will recover that CAC.
Conversion efficiency is different. It is determined by what happens after the lead exists. It includes speed-to-follow-up, lead routing logic, nurture sequences, sales discovery quality, and the accuracy of your scoring model. A team that follows up within the first hour of a lead converting operates at a fundamentally different effectiveness level. The compounding impact of routing speed on conversion rates is significant enough to treat it as infrastructure, not process.
The practical test: pull your last 90 days of closed-lost deals and categorise them. If the majority were lost because the lead was never a good fit in the first place, the problem is targeting and messaging. If the majority were lost later in the cycle, to a competitor or due to budget or timing, the problem is conversion efficiency and sales execution.
Lead Scoring as a Diagnostic Lever
Lead scoring is often implemented once and rarely revisited. For teams with a siloed MarTech stack, the scoring model in the MAP may not reflect what the CRM data shows about what leads actually close.
Behavioural scoring models, which weight actions like repeat site visits, pricing page views, and specific content consumption, consistently outperform demographic-only models for predicting close rates. B2B SaaS companies using behavioural scoring models achieve MQL-to-SQL conversion rates approaching 40%, compared to teams relying on basic demographic criteria.
The practical implication is that scoring models need to be calibrated against actual win data, not assumptions. If your model assigns high scores to leads based on company size and job title, but your CRM data shows that the leads most likely to close came from specific intent signals, your model is generating false positives that inflate the top of the funnel and burn sales time.
For marketing operations specialists working across siloed platforms, the first step is a quarterly reconciliation: take the leads your scoring model flagged as high-quality in a given period, and check how many closed. If the close rate on your top-scored leads is not meaningfully higher than your average, the model is not working. That is a data problem, not a campaign problem.
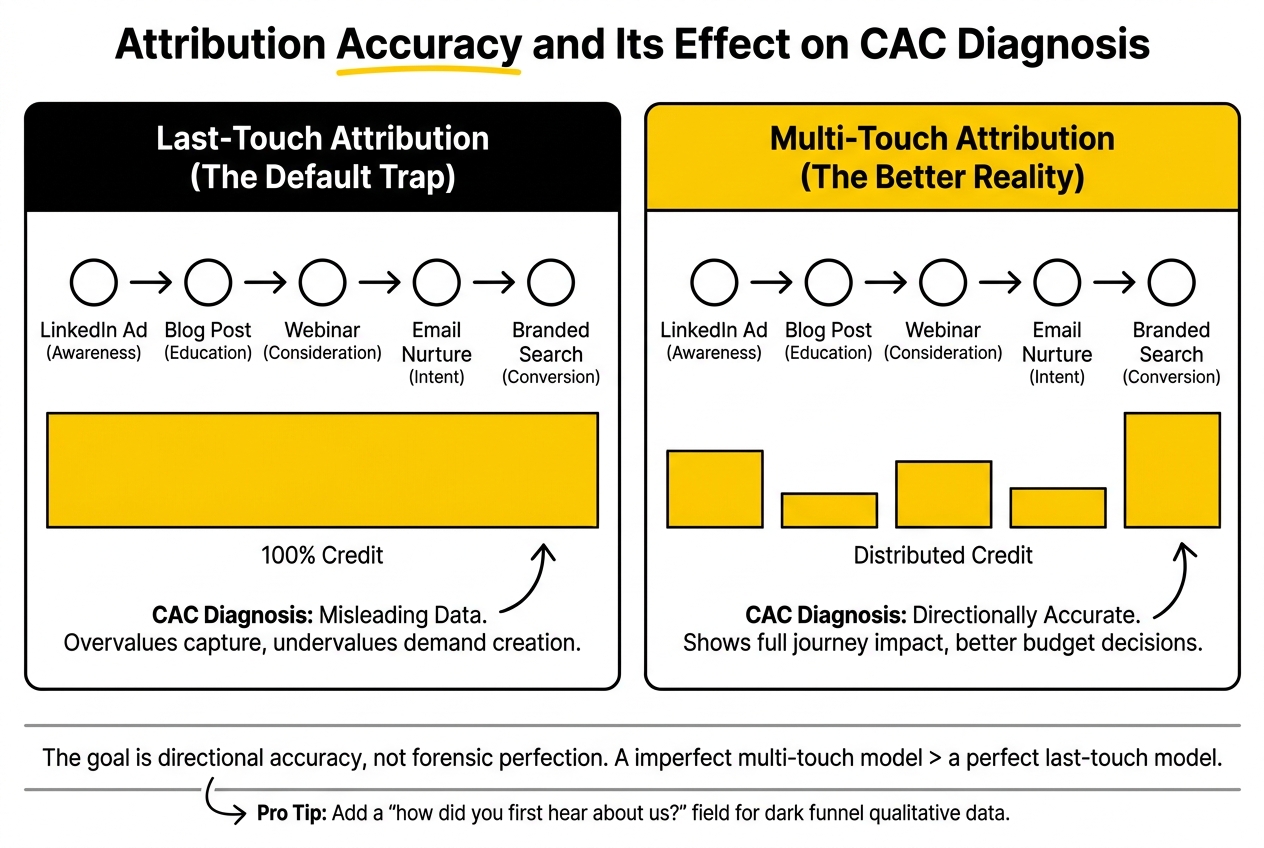
Attribution Accuracy and Its Effect on CAC Diagnosis
Diagnosing customer acquisition cost issues accurately requires reliable attribution data. Without it, you are making CAC decisions based on partial information, and the levers you pull will not match the levers that are actually driving the problem.
Last-touch attribution, still the default in many B2B MarTech stacks, systematically overvalues bottom-of-funnel channels and undervalues the channels that created demand earlier in the cycle. A lead that clicked a branded search ad as their final touch before converting did not start their journey there. If that context is missing, the attribution model will tell you to cut budget from demand-creation channels that were doing real work.
Multi-touch attribution does not need to be perfect to be useful. Refine Labs has made the case consistently that the goal of attribution in B2B SaaS is directional accuracy, not forensic precision. A model that assigns credit across first touch, middle-funnel, and last-touch interactions will give you more reliable CAC diagnosis data than a last-touch model, even if the weighting is imperfect.
For teams who want to support their attribution data with qualitative signal, adding a single field to your demo request form asking “how did you first hear about us?” captures dark funnel data that no analytics tool will surface. The answers are often instructive.
For more on building the measurement infrastructure that supports reliable CAC analysis, our conversion rate optimisation services cover the full attribution and tracking setup.
Common Bottlenecks to Check First
When a lead-to-customer conversion rate analysis flags a problem, these are the most frequently encountered causes:
- Misaligned MQL definition. Marketing and sales are using different criteria. Marketing passes leads that score well against behavioural thresholds. Sales declines them on fit grounds. The gap inflates MQL volume and deflates conversion rates simultaneously.
- Slow lead routing. Leads that take 24 hours or more to receive follow-up convert at a fraction of the rate of leads contacted within the first hour. If your routing logic involves manual steps or is dependent on CRM field population, this is often the cause.
- Lead source mismatch. Different channels produce leads with very different close rates. Paid search leads, organic leads, and referral leads behave differently throughout the funnel. Aggregating them into a single conversion rate hides which channels are actually contributing to CAC inflation.
- Ad quality score degradation. A declining ad quality score in your PPC campaigns increases CPC over time and reduces impression share on high-intent queries. If your quality score has dropped, your cost-per-lead rises even when conversion rate holds steady. Check this alongside conversion data, not in isolation.
- Funnel stage definitions drifting over time. In many B2B SaaS teams, what counts as an SQL changes informally as teams evolve. If your SQL definition has softened, your MQL-to-SQL conversion rate will appear to improve while your downstream close rate falls. This is one of the more insidious forms of reporting drift.
A Practical Diagnostic Sequence
Rather than reviewing all metrics simultaneously, work through the funnel in sequence. Start where the volume is, and follow the attrition.
- Pull your lead-to-MQL conversion rate for the past 90 days. Compare by channel and campaign. Identify the sources with the lowest MQL rate.
- Pull your MQL-to-SQL rate and filter by the same lead sources. Confirm whether the low-MQL-rate sources are also driving low SQL conversion, or whether a different set of sources are the bottleneck at this stage.
- Pull your SQL-to-opportunity and opportunity-to-close rates. Cross-reference with the lead sources from step one. If the close rates for leads from specific sources are consistently below your average, the issue is targeting, not conversion efficiency.
- Check your CRM data for untracked attribution gaps. Leads with no recorded first-touch source often represent 15, 25% of a typical B2B SaaS CRM. These distort conversion rate calculations. Clean or flag them before drawing conclusions.
- Review your lead scoring model against actual closed-won data. Recalibrate any scoring criteria that are not correlated with close rates.
This sequence will surface the specific stage driving CAC inflation in most cases. The fix will be different depending on where the breakdown is, but you will not be guessing at it.
Improving CAC through rebalancing how you invest across channels is a related but separate decision. Once you have diagnosed the conversion problem, a future article will cover how to improve CAC without cutting strategic channels through media mix rebalancing.

Frequently Asked Questions
What is a good lead-to-customer conversion rate?
For B2B SaaS companies, a compounded lead-to-customer rate between 2% and 5% is typical across most verticals when all funnel stages are included. That figure varies significantly by channel, ACV, and sales cycle length. Referral-sourced leads convert at substantially higher rates than paid search leads. The more useful benchmark is internal: your conversion rate by channel and cohort, tracked consistently over time, is a stronger diagnostic signal than any industry average.
How do you measure customer conversion rates?
Measure conversion rates at each funnel stage separately: lead to MQL, MQL to SQL, SQL to opportunity, and opportunity to close. Use your CRM as the source of record and ensure that each stage has a consistent, agreed definition between marketing and sales. Aggregate tools like HubSpot or Salesforce dashboards can automate this reporting, but the accuracy of the data depends entirely on how consistently stages are being updated.
What factors influence lead-to-customer conversion rates?
The main factors are lead source quality, speed of follow-up, lead scoring accuracy, the alignment between marketing messaging and sales conversations, and the quality of discovery and qualification at the SQL stage. Sales cycle length and ACV also affect conversion rates structurally. Teams selling six-figure contracts will have lower close rates than those selling monthly subscriptions, even with better sales execution.
How can improving conversion rates reduce Customer Acquisition Cost (CAC)?
CAC is a function of spend divided by customers acquired. If you increase the number of customers acquired from the same spend by improving conversion at any stage, CAC falls. A 20% improvement in MQL-to-SQL conversion, assuming all other stages hold, reduces CAC proportionally without changing media investment. This is why conversion rate improvements are often more capital-efficient CAC reduction levers than budget reallocation.
What is the average conversion rate for customer acquisition across different industries?
Lead-to-customer conversion rates vary considerably. B2B SaaS teams with developer tool products can achieve lead-to-customer rates of 22, 35% when targeting is tight and onboarding is strong. FinTech and enterprise security typically sit lower at 8, 15%, reflecting longer buying cycles and more complex procurement. These ranges come from 2025 benchmark data compiled across hundreds of SaaS businesses. Segment your own data by vertical and ACV tier before benchmarking externally.
How can marketing operations specialists diagnose CAC problems using conversion rates?
Start by disaggregating CAC into its sub-metrics: CPC, conversion rate, and win rate. Then break down conversion rate by funnel stage and lead source. The stage with the most disproportionate attrition relative to benchmark is almost always where the CAC problem originates. Cross-reference stage conversion rates with lead source data to confirm whether the issue is targeting-driven or process-driven.
What strategies can enhance lead-to-customer conversion rates?
The highest-impact changes are: calibrating lead scoring to match actual closed-won data, reducing lead routing time to under one hour, improving the handoff information passed from marketing to sales with each lead, and implementing stage-by-stage reporting that makes conversion drop-offs visible. These changes do not require new tooling. They require operational rigour and sales-marketing alignment on shared definitions.
How do Cost Per Click (CPC) and Conversion Rate (CVR) impact CAC?
CPC and CVR are the first two multipliers in the expanded CAC formula. A rising CPC increases CAC directly if CVR holds steady. A falling CVR has the same effect. The two can also interact: if CPC rises because your quality score has declined, it is often a signal that your relevance to the searcher’s intent has dropped, which means CVR will typically fall at the same time. Monitoring both together, rather than in separate dashboards, gives a more accurate picture.
What are common bottlenecks in the sales funnel that affect conversion rates?
The most common are: misaligned MQL definitions between marketing and sales, slow lead follow-up, lead source mix changes that are not reflected in conversion benchmarks, and scoring models that have not been recalibrated against recent win data. Funnel stage definition drift, where what counts as an SQL changes informally over time, is one of the more overlooked causes of apparent conversion rate changes that are actually reporting artefacts.
How can data-driven strategies improve attribution accuracy in customer acquisition?
The practical steps are: moving from last-touch to a multi-touch attribution model, adding a self-reported attribution field to your key conversion forms, auditing your CRM for leads with missing source data, and reconciling attribution data across your ad platforms and CRM on a regular schedule. None of these steps requires a new analytics tool. Most of the value comes from ensuring that the data flowing between existing platforms is clean and consistently structured.
If you are working through a CAC diagnosis and finding the conversion data harder to interpret than it should be, this is the kind of problem we look at regularly with SaaS teams. Worth a conversation if you are at that point.