Measuring the Real Impact of Top-of-Funnel Social Campaigns
Discover frameworks for measuring assisted pipeline, view-through, and incremental lift in top-of-funnel social campaigns for SaaS.

Your top-of-funnel social campaigns look healthy in-platform. Impressions are up. Video completion rates are strong. Your CPMs are where you want them. Then the quarterly pipeline review lands and the board wants to know what social is actually contributing to revenue. You open five browser tabs, pull three exports, and try to reconcile numbers that were never meant to talk to each other.
This is the standard experience for Marketing Operations Specialists running top-of-funnel social at B2B SaaS companies. The platforms claim credit for everything. The CRM shows nothing. And the gap between those two positions is where most attribution conversations die.
Measuring top-of-funnel social campaign effectiveness is genuinely harder than measuring demand capture. Search clicks a button and converts. Social builds the conditions for that click to happen three weeks later. The measurement approach has to account for that lag, that influence, and that indirection, without creating a reporting model so complicated that it collapses under its own weight.
This article covers three frameworks that work in practice: assisted pipeline attribution, view-through measurement, and incremental lift analysis. Each one answers a different question about the impact of social media campaigns on lead generation and pipeline, and each one integrates with the MarTech infrastructure most SaaS marketing ops teams already have.
Why Last-Touch Attribution Undervalues Top-of-Funnel Social
Before getting into the frameworks, it is worth naming why the measurement problem exists in the first place.
Last-touch attribution gives 100% of the credit to the final touchpoint before conversion. For a prospect who saw a LinkedIn video three times, clicked a retargeting ad, and then converted through branded search, last-touch gives the credit to branded search. The social campaigns that built the awareness and intent register as zero. Your platform costs look unjustifiable, and your campaigns look like they are producing nothing.
The problem is not the attribution model per se. The problem is using a demand capture model to evaluate demand creation activity. Last-touch is a reasonable approximation for bottom-of-funnel paid search where the intent is explicit. It is a poor approximation for top-of-funnel social where the job is to move someone from unaware to in-market over weeks or months.
Multi-touch attribution marketing models distribute credit across touchpoints based on different weighting logic: linear (equal credit to each), time-decay (more credit to recent touchpoints), or position-based (more credit to first and last). None of them are perfect. But for top-of-funnel social, the goal is not precision, it is directional accuracy. A multi-touch model that shows social contributing to 30% of pipeline is more useful than a last-touch model that shows zero, even if the 30% is an estimate rather than a measurement.
Chris Walker and the Refine Labs research team have made the strongest case for this in B2B SaaS: the gap between where buyers spend their time (LinkedIn, communities, podcasts, dark social) and where attribution models look (trackable clicks, form submissions, known touchpoints) means that last-touch systematically understates top-of-funnel influence. The measurement problem is structural, and no amount of pixel placement will fully close it.
That is the starting point. The frameworks below are designed to close as much of that gap as practically possible.
Framework 1: Assisted Pipeline Attribution
What it measures: The pipeline value associated with deals where a top-of-funnel social touchpoint appeared in the buyer’s journey, regardless of whether social was the last or converting touch.
Why it matters: Assisted pipeline metrics show the influence of social without requiring it to be the closing touch. A deal worth £120,000 that included two LinkedIn ad impressions and one video view in the early stages should register something in your attribution model, even if the actual conversion came through a webinar or a direct outbound sequence.
Setting up assisted pipeline tracking
The foundation is connecting your social platforms to your CRM via UTM parameters and campaign tagging. Every paid social campaign should carry consistent UTM source, medium, campaign, and content parameters that map back to a recognisable taxonomy in your CRM. If you are using HubSpot, Salesforce, or Pipedrive, the contact-level and deal-level tracking is built for this, but it only works if the tagging is consistent from the start.
The second layer is first-touch and multi-touch attribution fields at the deal level. This means capturing not just the last form fill or demo request source, but every tracked touchpoint across the buyer journey. HubSpot’s attribution reporting does this natively. Salesforce requires more setup (campaign influence models, contact role tracking, and campaign membership records), but it supports more customisation for complex buying committee dynamics.
Once the deal-level data is in place, the reporting question becomes: for deals closed in a given period, how many had a social campaign touchpoint in the 90 days prior to conversion? What is the combined pipeline value of those deals?
That is your assisted pipeline number. It is an influence metric, not a causation claim. But it gives you something defensible to bring into a budget conversation that is not a CPM or an impression count.
Handling the attribution window
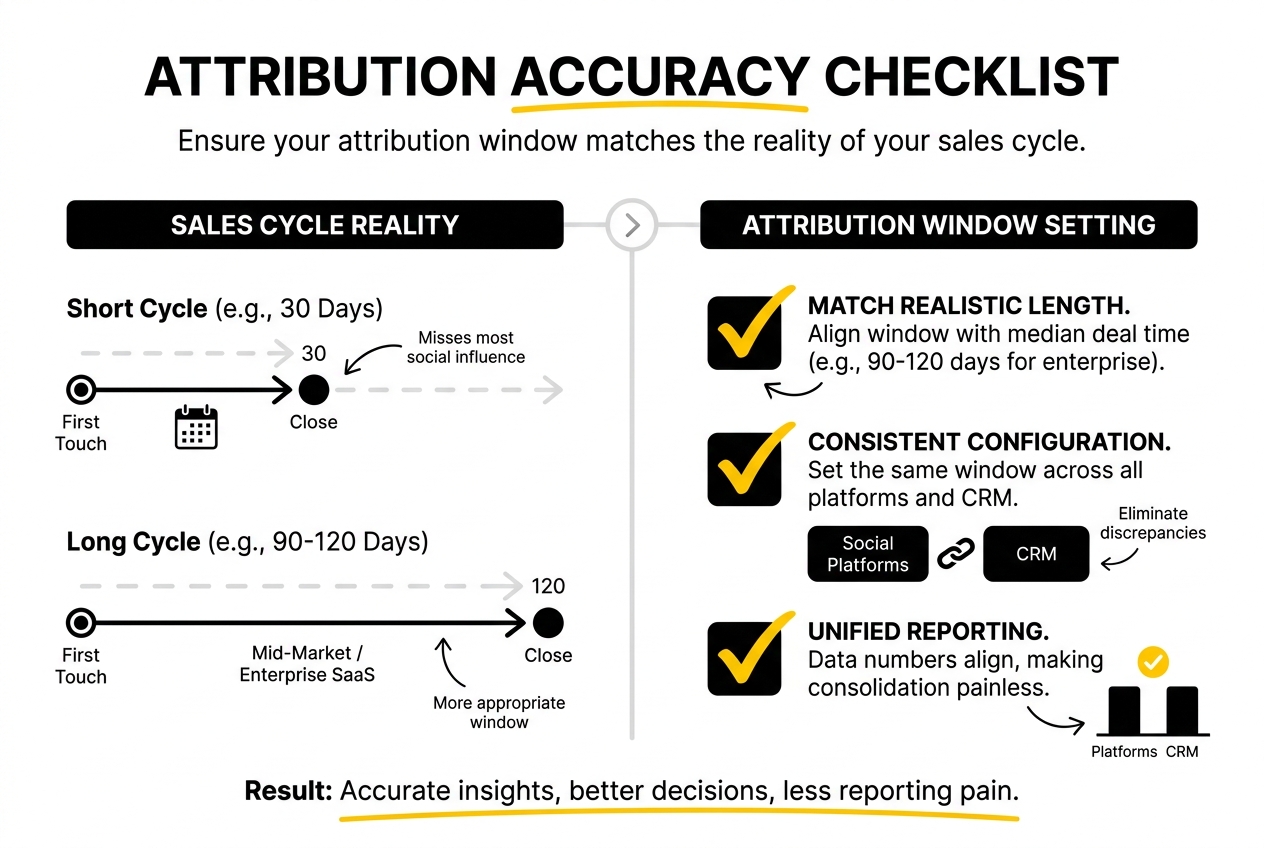
Attribution windows for top-of-funnel social should match the realistic length of your sales cycle. If your median deal takes 60 days from first touch to close, a 30-day attribution window will miss most of the social influence. For mid-market and enterprise SaaS, a 90 to 120-day window is more appropriate. This should be configured consistently across platforms and in your CRM so that the numbers align rather than creating the platform-vs-CRM discrepancy that makes reporting consolidation so painful.
Framework 2: View-Through Attribution
What it measures: Conversions or pipeline from users who were served a social ad (impression recorded) but did not click, and later converted through another channel.
Why it matters: A significant portion of the impact of social media campaigns on lead generation happens through impression-based influence rather than click-based conversion. Prospects see your ads, go to a search engine, find your site through branded search or direct navigation, and convert. None of that shows up in click-through attribution. View-through measurement recovers some of that signal.
Best practices for view-through metrics
View-through attribution carries real risk of inflation. Platforms like LinkedIn and Meta have financial incentives to show you large view-through conversion numbers, because it justifies their ad spend. Left unchecked, view-through windows of 28 or 30 days will attribute nearly every conversion in your ICP to a social impression, regardless of whether the impression had any meaningful influence.
Three guardrails keep view-through measurement credible:
- Short windows. Use 1 to 7-day view-through windows for bottom-of-funnel conversion events. Longer windows introduce too much noise. A prospect who saw your ad 25 days ago and converted today through organic search is probably not converting because of that impression.
- Holdout testing alongside view-through reporting. If your view-through numbers are high, run a holdout test (covered in the incremental lift section below) to check whether they hold up. If your holdout shows low incremental lift but your view-through is claiming large numbers, the view-through window is too generous.
- Separate view-through from click-through in your reports. Do not combine them into a single conversion number. Report them separately so you can see whether click-based performance is strong on its own, and how much view-through is adding on top.
The goal is not to maximise the attribution number. The goal is to have a view-through measurement methodology that you can defend when someone asks how you calculated it.
Framework 3: Incremental Lift Measurement
What it measures: The difference in conversion or pipeline rate between a group exposed to your campaigns and a control group that was not. The incremental lift is the genuine causal contribution of your social activity, stripped of organic baseline behaviour.
Why it matters: Assisted pipeline and view-through metrics tell you what happened alongside your campaigns. Incremental lift metrics tell you what happened because of your campaigns. It is the most rigorous of the three frameworks, and the most resource-intensive to run.
Running a lift study
Most major social platforms (LinkedIn, Meta, YouTube) offer native brand lift or conversion lift study tools. These randomly split your audience into an exposed group and a holdout group, run the campaign to the exposed group, and measure the difference in conversion behaviour between the two.
The output is a lift percentage: if the exposed group converted at 4% and the holdout converted at 3%, the incremental lift from the campaign is 33% (1 percentage point above a 3% baseline). That number is far more defensible in a business intelligence conversation than a view-through count.
The limitations are worth knowing. Native lift studies require minimum audience sizes (LinkedIn’s Conversion Lift requires at least 300,000 users in the target audience, typically limiting it to broader campaigns). They also measure lift across the entire exposed cohort, which may include brand awareness effects you cannot directly tie to pipeline. For SaaS teams with tightly defined ICPs and smaller addressable markets, native lift studies may not be operationally viable.
The alternative is a geo-based holdout test: hold back a defined geographic region or segment from your campaigns for a fixed period, then compare conversion and pipeline rates in the exposed region versus the holdout. This is more manual but does not require minimum audience sizes, and the results feed directly into your CRM reporting infrastructure.
Interpreting incremental lift results
A positive lift result validates that the campaign is generating real behaviour change above baseline. A near-zero or negative lift result means the campaign is reaching people who would have converted anyway, which is an expensive and inefficient use of budget.
For evaluating the actual impact of top-of-funnel social media initiatives, incremental lift data is the strongest proof point available. It addresses the fundamental objection to all attribution modelling: that correlation between social activity and pipeline is just reflecting organic demand rather than creating it. How to Build a SaaS PPC Engine for B2B SaaS (Not Just Run Ads), also on this blog, takes this further.
Integrating These Frameworks with Your MarTech Stack
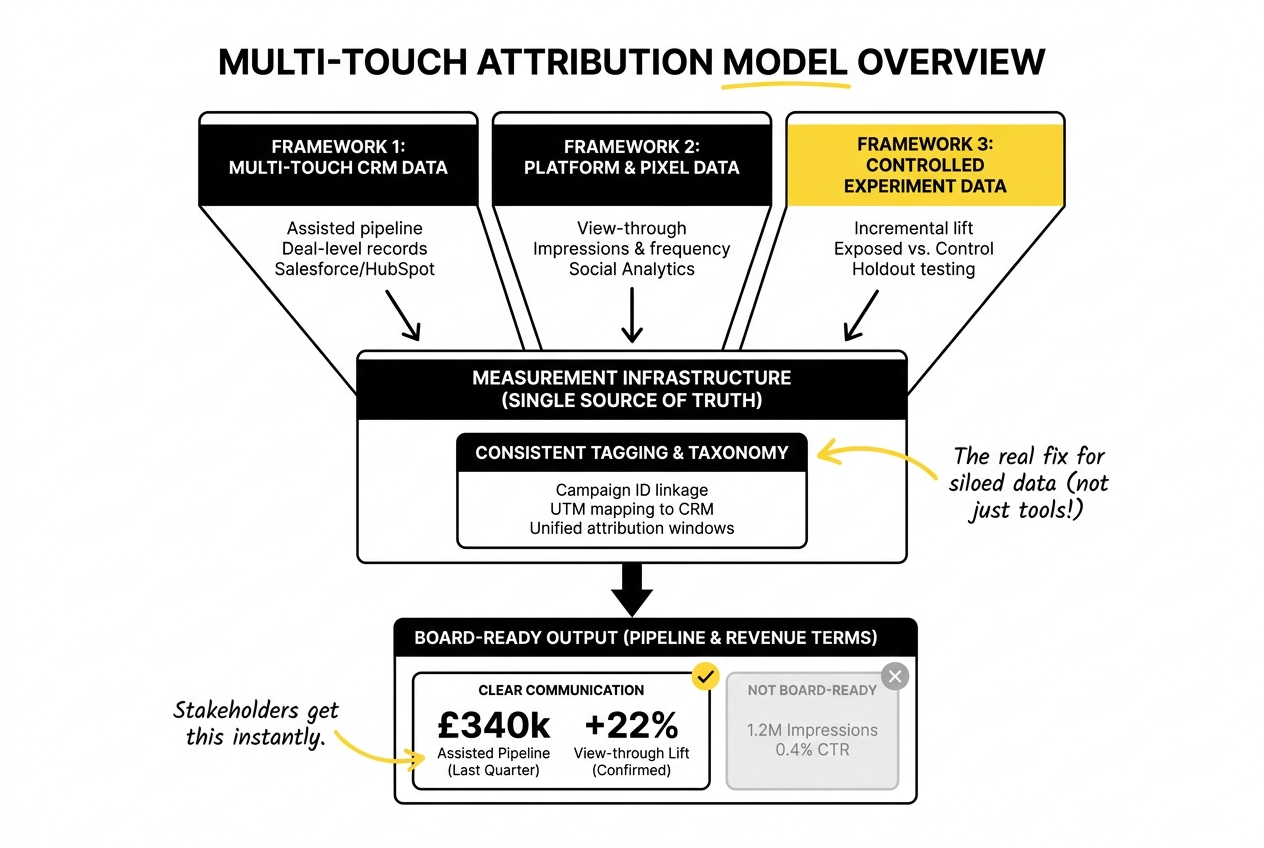
The three frameworks above produce different data types: multi-touch CRM data for assisted pipeline, platform and pixel data for view-through, and controlled experiment data for incremental lift. Making them work together requires a measurement infrastructure that does not force you to manually reconcile three spreadsheets every time someone asks a pipeline question.
The practical starting point is a single source of truth for deal-level attribution. Whether that is Salesforce, HubSpot, or a data warehouse like BigQuery or Snowflake, every deal should have a record of its associated campaign touchpoints, with consistent tagging back to the relevant social campaigns. Platform data (impressions, video views, frequency) sits separately in the analytics for social media marketing performance layer, and the two connect at the campaign ID level.
For teams using Google Analytics 4, the default attribution model has moved to data-driven attribution, which distributes credit algorithmically across touchpoints. GA4’s funnel exploration and conversion path reports give useful directional data on the role of social in multi-step journeys, though they are limited to tracked sessions and miss the dark social and direct navigation behaviour that Refine Labs research highlights as a significant blind spot.
The siloed data problem most marketing ops teams face is not primarily a tooling problem. It is a tagging and taxonomy problem. Campaigns named inconsistently across platforms, UTM parameters that do not map to CRM field values, and attribution windows that differ between the ad platform and the CRM are the operational causes of the “which number is right?” conversation. Fixing those upfront makes the reporting consolidation dramatically simpler.
A note on data visualisation
The output of these frameworks is only useful if it can be communicated clearly to stakeholders who are not going to read a methodology footnote. For assisted pipeline, a bar chart showing pipeline influenced by channel and campaign type, segmented by deal stage, is the clearest format. For incremental lift, a simple before/after comparison of exposed versus control group conversion rates communicates the finding without requiring the audience to understand the experimental design.
When reporting to stakeholders who are focused on operational and financial outcomes, translate the measurement into pipeline and revenue terms. “Our LinkedIn campaigns contributed to £340,000 in assisted pipeline last quarter, with a view-through lift of 22% confirmed by holdout testing” is a board-ready statement. “We got 1.2 million impressions and a 0.4% CTR” is not.
Justifying Your Attribution Model to Stakeholders
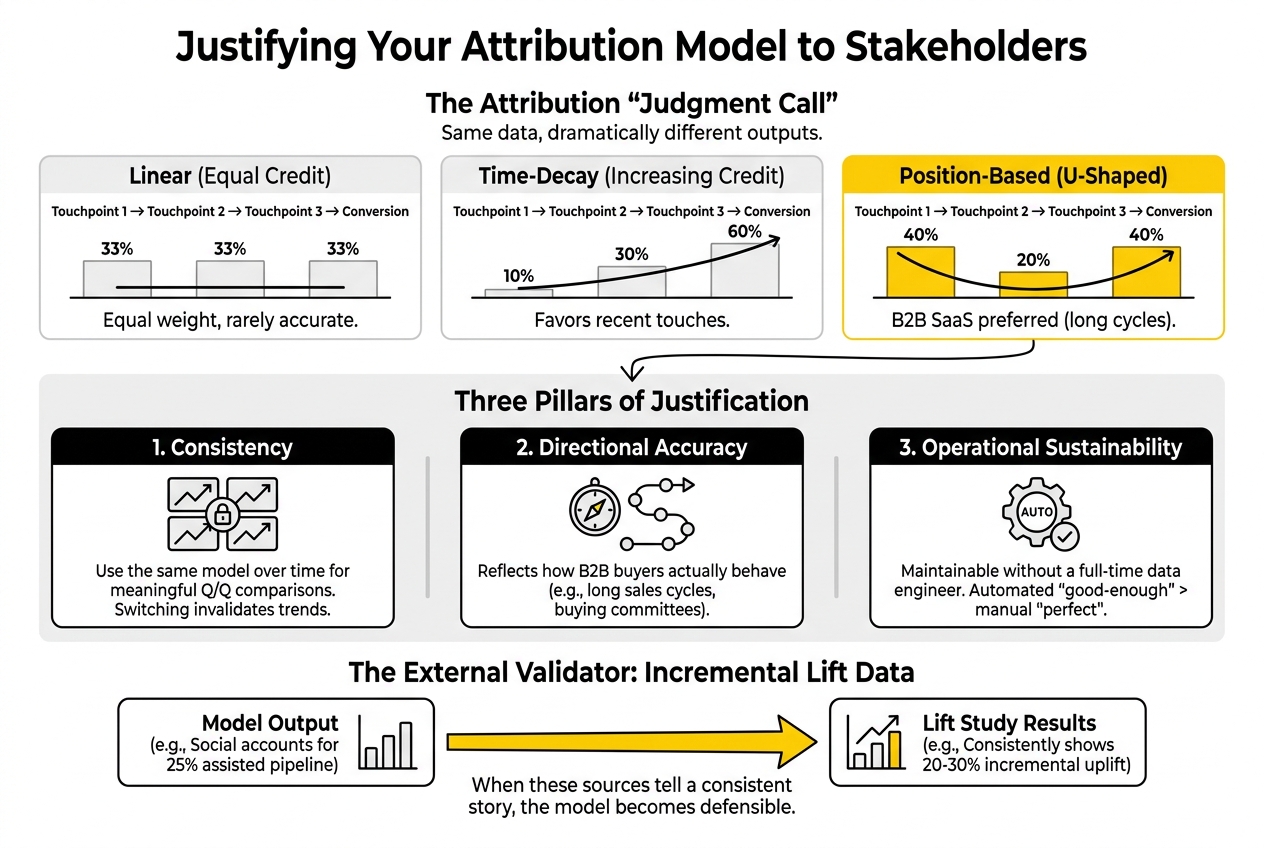
Multi-touch attribution modelling is a judgment call, not a mathematical truth. Different models produce different outputs, and anyone who has run the same dataset through linear, time-decay, and last-touch attribution in parallel knows how dramatically the numbers can vary.
When justifying your model choice, focus on three things: consistency, directional accuracy, and operational sustainability.
- Consistency means using the same model over time so that quarter-over-quarter comparisons are meaningful. Switching attribution models mid-year invalidates your trend data.
- Directional accuracy means choosing a model that reflects how your buyers actually behave. For B2B SaaS with long sales cycles and buying committees, a position-based model (more credit to first and last touch) or a time-decay model tends to be more representative than last-touch or linear equal weighting.
- Operational sustainability means the model can be maintained without requiring a full-time data engineering resource. A perfect attribution model that takes two weeks to update is less valuable than a good-enough model that updates automatically.
The incremental lift data is your external validator. If your multi-touch attribution model says social accounts for 25% of assisted pipeline, and your lift studies consistently show 20-30% incremental conversion uplift from social exposure, the two data sources are telling a consistent story. That consistency is what makes the model defensible.
For a broader look at how attribution fits into your overall b2b saas digital marketing programme, that context is worth having before building out the measurement layer.
Frequently Asked Questions
How can I measure the impact of top-of-funnel social campaigns on assisted pipeline metrics?
Set up consistent UTM tagging across all social campaigns that maps to your CRM’s campaign and deal attribution fields. Enable multi-touch attribution at the deal level in HubSpot or Salesforce and define an attribution window that matches your typical sales cycle (90 to 120 days for most B2B SaaS). Assisted pipeline is then the total deal value where at least one social campaign touchpoint appears in the buyer journey within the attribution window, regardless of whether social was the converting touch.
What are the best practices for measuring view-through metrics in social campaigns?
Keep view-through windows short (1 to 7 days for bottom-of-funnel conversion events). Report view-through and click-through attribution separately so you can see each contribution distinctly. Run periodic holdout tests alongside view-through reporting to validate that the view-through numbers reflect real lift rather than platform over-attribution. The goal is a defensible methodology, not the largest number.
How do I calculate incremental lift from social media campaigns?
Either use a native lift study tool on LinkedIn, Meta, or YouTube (requires minimum audience sizes) or run a geo-based holdout test by withholding campaigns from a defined region or segment for a fixed period. Incremental lift is calculated as the difference in conversion or pipeline rate between the exposed group and the control group, expressed as a percentage above the baseline. This is the most rigorous method for measuring whether your campaigns are causing behaviour change rather than just correlating with it.
What challenges do Marketing Operations Specialists face when measuring top-of-funnel campaign effectiveness?
The most common challenges are inconsistent campaign tagging that prevents CRM and platform data from connecting cleanly, attribution windows that differ between systems, platform over-attribution in view-through reporting, and the absence of a single source of truth for deal-level touchpoint data. Most of these are taxonomy and process problems, not tooling problems. They require alignment on naming conventions, UTM standards, and attribution window definitions before the measurement frameworks will produce reliable numbers.
How can I integrate measurement practices with existing MarTech stacks for better attribution?
The integration point is the campaign ID, which should be consistent from the ad platform through UTM parameters to the CRM deal record. Use a UTM taxonomy that maps directly to the field values in your CRM. For teams using a data warehouse (BigQuery, Snowflake), a centralised pipeline attribution table that joins platform impression data with CRM deal data at the campaign ID level eliminates the manual reconciliation step entirely. For smaller teams without a warehouse, HubSpot’s native multi-touch attribution or Salesforce’s campaign influence model is sufficient if the tagging discipline is in place.
How does siloed data affect the accuracy of marketing attribution?
Siloed data means that platform-reported conversion data, CRM-attributed pipeline data, and finance-reported revenue data are calculated using different logic, different attribution windows, and different touchpoint definitions. The result is three versions of the truth that cannot be reconciled. The fix is not a new tool; it is agreement on a single attribution methodology that all teams use as the reference number, with the other data sources treated as supplementary context rather than competing claims.
What methodologies can enhance the reliability of reporting for social campaigns?
Consistency in tagging and taxonomy is the foundation. Beyond that, pairing multi-touch attribution with periodic incremental lift studies gives you both a continuous tracking metric (assisted pipeline) and a periodic validity check (lift). This combination means you are not fully dependent on any single measurement approach, and discrepancies between the two signal either a measurement problem or a genuine change in campaign performance.
How can I justify my multi-touch attribution model choices to stakeholders?
Focus on three arguments: the model is consistent over time (enabling meaningful trend analysis), it reflects observed buyer behaviour (long sales cycles, multi-touchpoint journeys), and it is validated periodically by incremental lift studies that test causal impact rather than correlation. Acknowledge that no model is perfectly accurate, but frame the goal as directional consistency rather than precision. A model that consistently tracks the relative contribution of channels over time is more valuable for decision-making than an attempt at exactness that changes methodology every quarter.
Where to Go From Here
Attribution for top-of-funnel social is never going to be a clean closed-loop system. The buying journey crosses too many untracked touchpoints, too many dark social interactions, and too many offline conversations for any model to claim full coverage.
What these three frameworks give you is a measurement approach that is honest about its limitations, defensible in a pipeline review, and integrated with the infrastructure you already have. Assisted pipeline shows influence. View-through shows impression-driven behaviour. Incremental lift tests causation. Together, they produce a more complete picture than any single model can.
If you are currently working through the measurement setup for a top-of-funnel social programme, or trying to consolidate attribution reporting across a fragmented MarTech stack, we work through this regularly with B2B SaaS teams. Worth a conversation if the problem is live.