Effective Measurement Strategies for Upper-Funnel SaaS Demand Generation
How to measure upper-funnel SaaS demand gen beyond last-click attribution, using metrics and methods that connect demand creation to real pipeline.

You fund the top of the funnel. LinkedIn ads, YouTube, content promotion, the podcast. Reach climbs, engagement looks healthy, and then last-click attribution hands all the credit to branded search and direct traffic. On paper, the upper funnel converted nothing.
So someone suggests cutting it. The numbers seem to support the call. Six months later, pipeline thins out, branded search softens, and nobody can quite explain why. The demand that fed the bottom of the funnel was being created at the top, and the reporting never showed it.
That is the measurement problem at the heart of b2b demand generation. Upper funnel SaaS demand generation metrics do not behave like capture metrics, and trying to measure demand creation with a tool built for demand capture will mislead you every time. This article is about measuring the top of the funnel honestly: the metrics that matter, the attribution models that move beyond last click, and the methods that connect educational and awareness activity to pipeline. For the wider paid strategy this sits inside, our saas demand generation hub is the place to start; this piece is specifically about measurement.
Why last-click can't see upper-funnel demand gen
Last-click attribution answers one question well: which touch immediately preceded the conversion? For demand capture, that is often enough. Someone searches, clicks, converts, and the channel that caught the intent gets the credit it earned.
Upper-funnel demand generation does something different. It creates demand that converts weeks or months later, usually through a different channel. A buyer watches your content, sits with the problem, and eventually arrives via a branded search or a direct visit. Last-click sees the branded search. It never sees the work that caused it.
This is the distinction Refine Labs built its measurement philosophy around: demand creation and demand capture are different jobs, and last-touch models systematically over-credit capture while starving the activity that fills the funnel. Creating demand happens upstream, often in places analytics cannot track at all.
That untracked space is real and large. SparkToro's research shows that around two-thirds of US Google searches now end without a click to the open web, and a growing share of B2B research happens in feeds, communities, podcasts, and AI answers that leave no trace in your CRM. The click your attribution model records is the tail end of a buyer's journey that mostly happened where you could not measure it. Judge the upper funnel by last click and you are grading it on the one moment it was least responsible for.
The upper-funnel metrics that actually matter
Measuring brand awareness in SaaS marketing usually fails for the opposite reason: teams track activity metrics that feel like progress but say nothing about demand. Impressions and reach tell you the ad ran. They do not tell you whether anyone who matters moved.
Useful upper-funnel measurement works in three tiers, from leading to lagging.
- Qualified reach and engagement. Not raw impressions, but reach within your ICP: views from target accounts, video view-through among the right job titles, repeat content engagement. Necessary, but never the end of the story.
- Demand signals. The early evidence that creation is working: branded search volume, direct traffic from target accounts, return visit rate, and self-reported source on forms. These are the first place demand creation becomes visible.
- Pipeline indicators. The lagging proof: marketing-sourced and marketing-influenced pipeline, MQL-to-SQL rate by first-touch channel, and pipeline velocity. This is where upper-funnel work connects to revenue.

If you track one thing more closely, make it branded search volume. It is the most underrated demand generation metric in SaaS. When upper-funnel spend rises and branded search climbs a few weeks later with nothing else changing, that lift is your top of funnel doing its job, captured in a number a board will understand.
Advanced attribution methods for connecting upper-funnel to revenue
There is no attribution model that perfectly credits demand creation. The teams who measure the upper funnel well do not chase one. They triangulate, using several imperfect methods that fail in different directions so the errors partly cancel out. Choosing among attribution models for SaaS demand gen is less about finding the right one and more about combining a few deliberately.
Four advanced attribution methods do most of the work.
- Multi-touch attribution. A W-shaped or time-decay model as your default lens, giving early touches real credit instead of zero. We cover model selection in depth in our companion piece on attributing channel influence across long sales cycles.
- Self-reported attribution. A "how did you hear about us" field on demo and contact forms. Crude, but it catches the dark funnel that tracking misses entirely.
- Branded search lift. Correlating demand creation spend with branded search volume over the following weeks. Cheap to run with Search Console data.
- Incrementality testing. Geographic or temporal holdouts that show whether a channel caused pipeline or merely coincided with it.
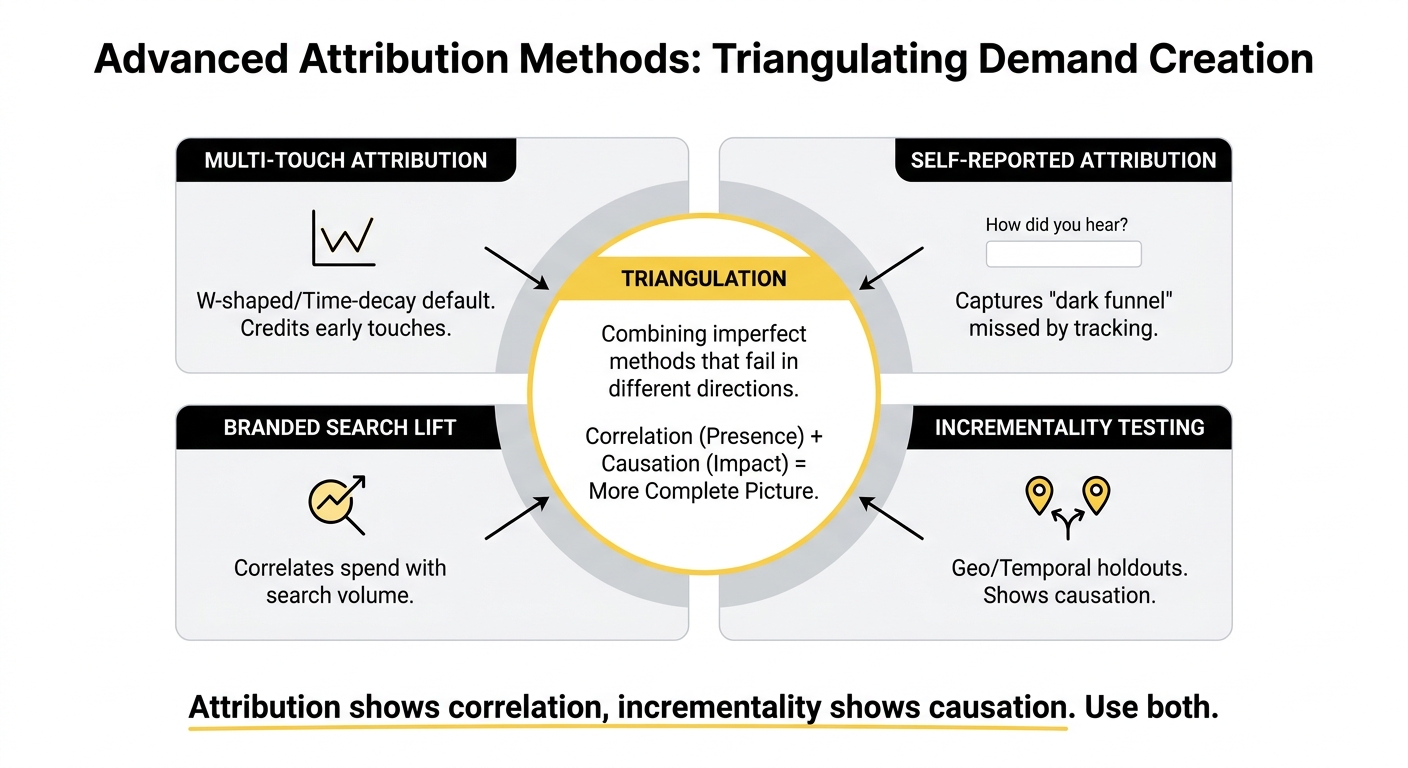
The principle underneath all of this: attribution shows correlation, incrementality shows causation. A multi-touch model can tell you a channel was present in winning journeys. Only a holdout tells you the pipeline would not have happened without it.
Self-reported attribution: the cheapest upgrade
If you do one thing this quarter, add a self-reported source question to your demo and contact forms. It costs almost nothing and it surfaces the channels your tracking cannot see: the podcast, the peer recommendation, the founder's post someone screenshotted into a Slack group.
It is not precise, and buyers misremember. But aggregated across hundreds of responses, self-reported attribution consistently reveals demand creation channels that last-click reports value at zero. For a demand gen leader fighting to defend upper-funnel budget, it is the fastest evidence you can put on the table.
Incrementality testing without a data science team
Incrementality sounds like it needs a quant team. It does not. The lightweight version is a geo-holdout: pause a demand creation channel in a few comparable regions for 30 days, then compare qualified pipeline against the regions where it kept running.
Keep it simple. One clean test per quarter beats five noisy tests run at once. The discipline that ruins these experiments is impatience: short windows and too many simultaneous changes. Pick one channel, give it a fair window, and you get something attribution alone can never provide, which is evidence of cause.
Educational content and the full customer journey
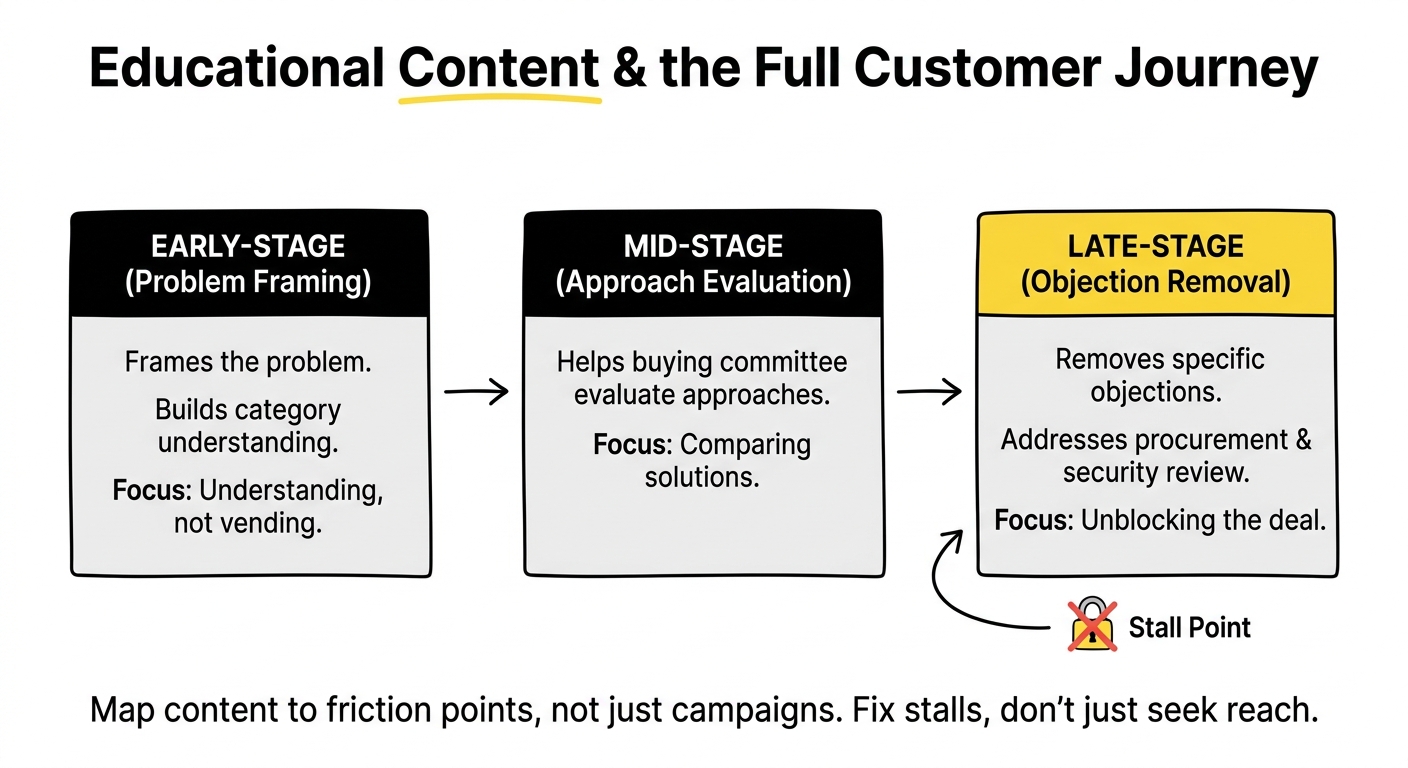
Most upper-funnel demand in SaaS is created by educational content. Not product pages, but the material that helps a buyer understand their problem before they are looking for a vendor. Measuring educational content impact means tracking it as demand creation, not as a lead source waiting to be optimised for form fills.
To understand the customer, map content to the journey rather than to a campaign. Early-stage content frames the problem and builds category understanding. Mid-stage content helps a buying committee evaluate approaches. Late-stage content removes the specific objections that stall deals at procurement or security review.
A useful way to read customer journey examples is to look at where deals stall, not just where they start. If opportunities consistently die at the security review, that is a late-stage content gap, not a top-of-funnel volume problem. Reading the full customer journey this way tells you which educational content is actually missing, and it keeps upper-funnel investment pointed at real friction rather than vanity reach.
Reporting upper-funnel to stakeholders without overclaiming
The hardest part of upper-funnel measurement is not the data. It is reporting it to a board that wants a clean cost-per-lead and a monthly trend line. Demand creation does not produce either, and pretending it does erodes trust the moment the numbers wobble.
Report the upper funnel on the timeline it actually operates on. Demand creation compounds: work done this month shows up in pipeline two and three quarters later. Present it on a trailing four-to-six quarter basis, pairing leading indicators (branded search, qualified reach, self-reported source mix) with the lagging pipeline they eventually produce. Show the lag rather than hiding it.
Here is the position worth holding. Attribution will never be perfect, and the goal is consistent, directional data, not false precision. A demand gen leader who reports honestly, states the uncertainty, and shows the trailing trend builds far more credibility than one whose upper-funnel numbers look suspiciously clean every month. Honesty about what you cannot measure is what makes the rest of your reporting believable.
A practical measurement plan for upper-funnel demand gen
Pulling this together into a demand generation plan you can run without a measurement team looks like this.
- Separate creation from capture. Decide which channels are meant to create demand and which are meant to capture it, and stop judging the first group by the second group's metrics.
- Instrument self-reported attribution now. Add the source question to every form this week. It is the highest-return change available.
- Set a default multi-touch lens. Use W-shaped or time-decay so early touches get credit, and treat its output as one input, not the verdict.
- Track branded search lift. Pull branded search volume monthly and correlate it with demand creation spend.
- Run one incrementality holdout per quarter. One channel, one clean geo or temporal test, a fair window.
- Report on trailing windows. Pair leading indicators with four-to-six quarter trailing pipeline. Show the lag.
- Review with sales. Their read on which touches actually moved a committee is the cheapest correction you have.
None of this requires enterprise tooling. It requires deciding what the top of the funnel is for and measuring it on its own terms. That is the difference between a top of funnel you can defend and one that gets cut the first time someone reads a last-click report.
If you are working through this, an upper funnel you believe in but cannot yet prove, this is the kind of measurement setup we build with SaaS demand gen teams regularly. Worth a conversation if you are at that point.
Frequently Asked Questions
What are the key metrics for measuring upper-funnel SaaS demand generation?
Work in three tiers. Leading metrics are qualified reach and engagement within your ICP, not raw impressions. Demand signals are branded search volume, direct traffic from target accounts, return visits, and self-reported source on forms. Lagging metrics are marketing-sourced and marketing-influenced pipeline, MQL-to-SQL rate by first-touch channel, and pipeline velocity. Branded search lift is the single most useful upper-funnel signal for most SaaS teams.
How can demand generation leaders effectively measure upper-funnel marketing efforts?
Stop using last-click as the verdict and triangulate instead. Combine a multi-touch model, self-reported attribution on forms, branded search lift tracking, and one incrementality holdout per quarter. Each method is imperfect, but they fail in different directions, so together they give a directional read on what demand creation actually produces. Report it on a trailing multi-quarter basis rather than monthly.
What advanced attribution methods can be used to connect upper-funnel activities to revenue outcomes?
Four methods do most of the work: multi-touch attribution (W-shaped or time-decay), self-reported attribution via a "how did you hear about us" form field, branded search lift correlation, and incrementality testing through geo or temporal holdouts. The key distinction is that attribution shows correlation while incrementality shows causation. Only a holdout proves the pipeline would not have happened without the channel.
How does the full customer journey impact upper-funnel demand generation strategies?
In SaaS, the journey runs across weeks or months and a buying committee, with most research happening in channels you cannot track. Upper-funnel activity creates demand early that converts much later through a different channel. Measuring the full customer journey means crediting those early touches and reading where deals stall, so investment targets real friction rather than the final click.
What role does educational content play in upper-funnel demand generation?
Educational content is the main engine of demand creation in SaaS. It helps buyers understand their problem before they are evaluating vendors, building the category understanding and trust that later turns into branded search and inbound. Measure its impact as demand creation, tracked through demand signals and self-reported attribution, rather than judging it on immediate form fills it was never designed to produce.
How can B2B SaaS companies improve lead quality through upper-funnel strategies?
Upper-funnel work improves lead quality by attracting buyers who already understand their problem and your category, which shortens evaluation and raises MQL-to-SQL conversion. Educated demand converts better than demand bought through aggressive form-fill tactics. Track lead quality by source over time; the immediate scoring mechanics of MQL quality are a separate topic we cover in our dedicated piece on measuring lead quality in SaaS PPC.
What are the common challenges in measuring upper-funnel demand generation?
The main challenges are last-click models crediting the closing touch instead of the demand creator, the dark funnel hiding most B2B research, long lags between upper-funnel work and pipeline, and stakeholder pressure for clean monthly numbers the channel cannot produce. Resource constraints make heavy attribution tooling impractical, which is why lightweight triangulation beats waiting for a perfect system.
How can effective reporting on upper-funnel activities influence stakeholder decisions?
Good reporting protects upper-funnel budget from being cut on a misleading last-click read. Present leading indicators alongside trailing multi-quarter pipeline, show the lag between demand creation and revenue explicitly, and state what is directional rather than precise. Stakeholders fund what they can see; reporting the upper funnel on its real timeline lets them make decisions on evidence instead of on the channel that happened to close.
What are the best practices for scaling upper-funnel demand generation in B2B SaaS?
Scale only what you can measure. Separate creation from capture channels, instrument self-reported attribution before you increase spend, and establish branded search and pipeline baselines so growth is visible. Add budget to channels that pass incrementality tests, not ones that merely look good in last-click reports. Scaling on flawed measurement just amplifies waste, so the measurement foundation comes first.
How does understanding the nuances of upper-funnel demand generation enhance conversion rates?
When you understand that the upper funnel creates demand rather than capturing it, you stop optimising it for immediate conversion and start optimising it for qualified pipeline. Buyers who arrive already educated convert at higher rates and move faster through evaluation. Reading the full journey also shows where deals stall, so you can fix the content gaps that quietly suppress conversion further down the funnel.