A Comprehensive Guide to Multi-Region SaaS Paid Media Reporting
Discover how to normalise SaaS paid media reporting across currencies, funnel definitions, and regional maturity for accurate insights.

The US dashboard shows 200 conversions. The EU dashboard shows 180. Neither number is wrong, and neither number means what it looks like it means, because one platform counts a demo request and the other counts a form submission that has not yet been qualified. Add three currencies and a UK team that closes deals in six weeks against an EU team that closes in four months, and the board deck stops being a report. It becomes an argument nobody can settle without pulling raw data from every platform by hand.
Multi-region SaaS paid media analytics only works if the numbers being compared actually mean the same thing. Cross-region paid media reporting tools promise to solve this automatically, and some genuinely help, but the harder problem sits upstream of any tool: deciding what “equivalent” actually means before anything gets normalised. A saas marketing performance dashboard that blends currencies, funnel stages, and regional maturity without resolving that question first is not simplifying the picture. It is hiding the seams.
Why “Equivalent” Reporting Is Harder Than It Sounds
Equivalent multi-region saas advertising performance reporting is not the same exercise as combining numbers into one currency and one time zone. That part is mechanical. The harder part is deciding what counts as a comparable unit of performance when the underlying markets do not behave the same way.
A US self-serve motion might convert from click to paid customer in weeks. A UK or EU enterprise motion evaluated by committee might take months. Comparing this week's conversion count across both regions treats two fundamentally different sales processes as if they were interchangeable. The numbers normalise cleanly. The comparison they produce is still misleading.
Currency Normalisation: Constant Currency vs Spot Rate
Currency normalisation in marketing usually gets treated as a solved problem: convert everything to one reporting currency and move on. In practice, the choice of conversion method changes what the numbers actually show.
Spot-rate conversion, using the exchange rate at the time of each transaction, reflects what was actually spent or earned in that moment, but it means a strong or weak currency month can make a region look like it improved or declined in performance when nothing about the underlying campaign actually changed. Constant-currency reporting, using a fixed exchange rate across a full comparison period, strips out currency movement so the underlying performance trend is visible on its own. For quarter-over-quarter or year-over-year comparisons, constant currency is almost always the more honest view. For a snapshot of actual spend this month, spot rate is the accurate one. The mistake is picking one and never stating which it is, so anyone reading the report assumes the other.
Funnel Definitions: When “Qualified Lead” Means Different Things in Different Regions
Funnel definitions in saas rarely stay identical across regions, even when everyone assumes they do. A UK sales team might define a qualified lead as anyone who books a call. A US team running a more automated qualification process might reserve that label for a lead that has passed a specific scoring threshold. Neither definition is wrong. They are simply not the same thing, and a report that adds them together as one number is adding two different metrics and calling the sum meaningful.
Before comparing funnel performance across regions, confirm:
- Each region's definition of MQL, SQL, and opportunity is documented, not assumed to match
- Where definitions genuinely differ for good operational reasons, the report labels them separately rather than blending them
- Any recent change to a region's qualification process is flagged, since a sudden jump or drop in “qualified leads” is often a definition change, not a performance change
Regional Maturity: Why the Same Metric Means Different Things at Different Stages
Regional maturity in marketing affects how a given number should be read, independent of whether the tracking is accurate. A brand-new market with low awareness will show a higher cost-per-lead and a lower conversion rate than an established market almost by default, regardless of how well the campaigns are run, because a meaningful share of spend in a new market is doing category education rather than direct response.
Comparing a six-month-old EU campaign against a five-year-old US campaign on the same efficiency metrics, without adjusting for maturity, produces a report that looks like the EU team is underperforming when the more accurate read is that the market simply has not had time to mature yet.
Data Integrity: Standardising Fields and Attribution Before the Dashboard Sees Them
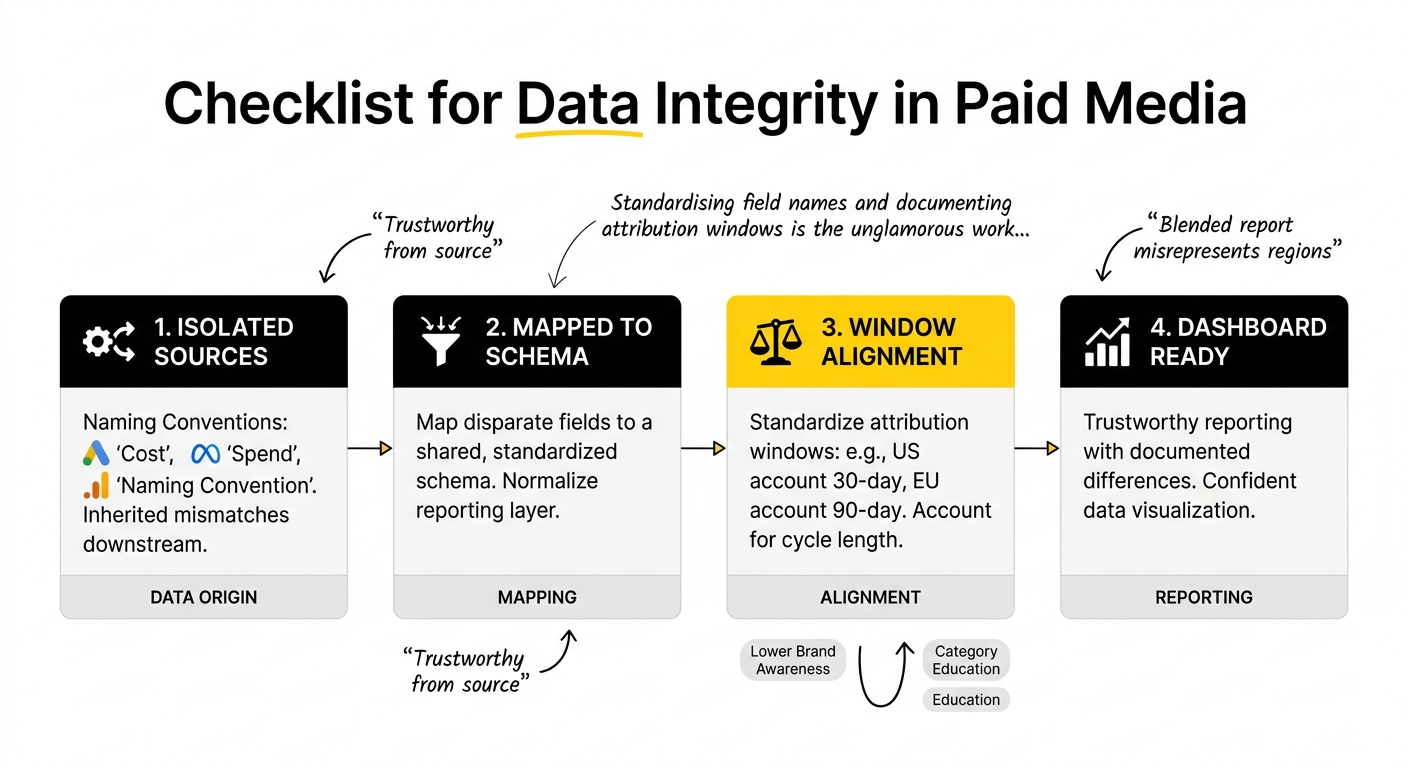
Data integrity in marketing starts before any dashboard renders a chart. Google Ads labels a metric “Cost.” Meta calls the same concept “Spend.” GA4 has its own naming conventions again. If these fields are not mapped to a shared schema before they reach the reporting layer, normalise paid media reporting is not actually happening, it is being asserted, and every number downstream inherits whatever mismatch existed at the source.
The same problem applies to attribution windows. If the US account uses a 30-day attribution window and the EU account uses 90 days to reflect a longer sales cycle, a blended report that does not account for that difference will consistently misrepresent one region relative to the other. Standardising field names and documenting attribution window differences before data reaches the dashboard is the unglamorous work that makes everything built on top of it trustworthy.
Attribution Accuracy Across Platforms and Regions
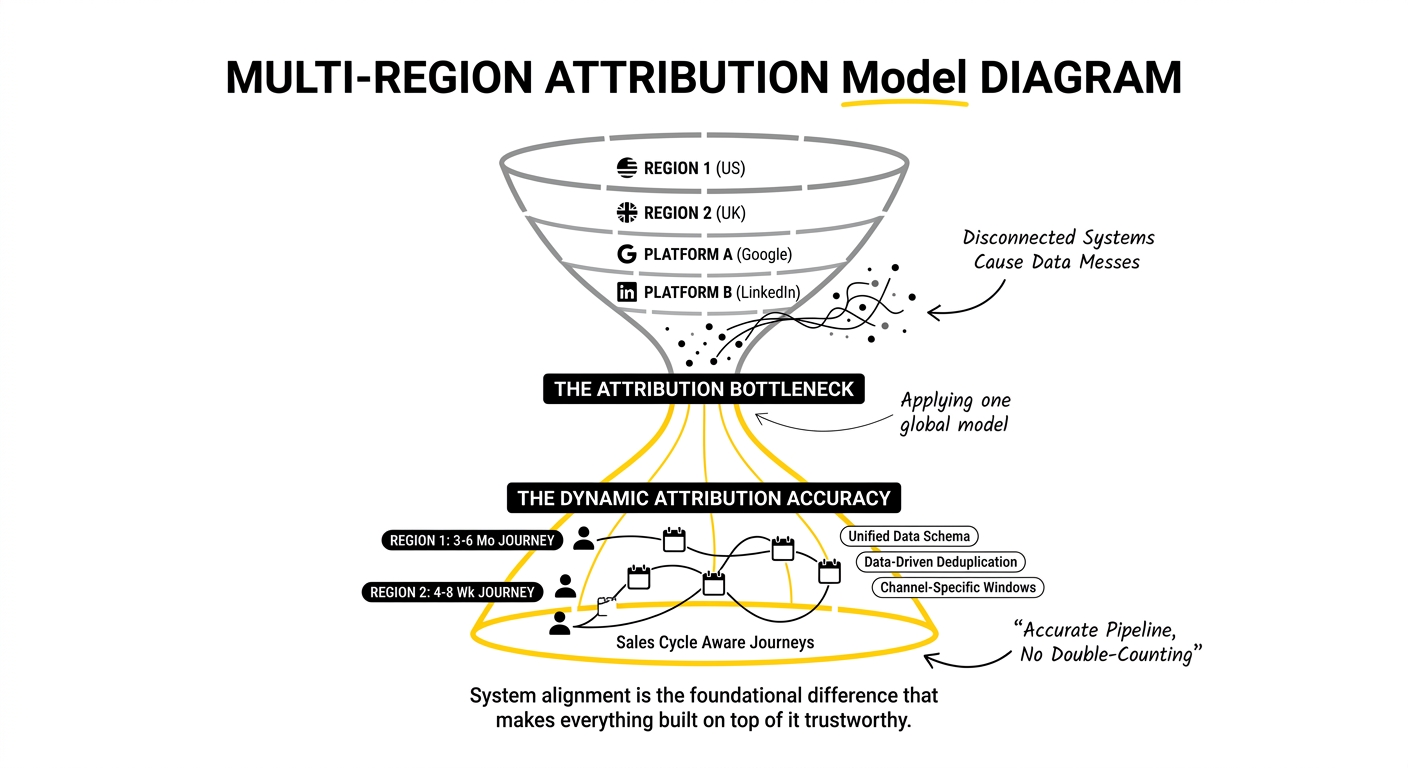
Attribution accuracy in paid media compounds in difficulty once multiple regions are involved, because the same buyer journey that spans months in one market might span weeks in another, and a single global attribution model applied uniformly will flatter the fast-closing region and understate the slow one.
Deduplication adds another layer. A buyer who clicks a Google ad in the UK office and later engages with a US-targeted LinkedIn campaign while travelling can generate a conversion event in two regional reports simultaneously if the systems are not talking to each other. Left unresolved, this double-counts pipeline and inflates the apparent performance of both regions at once.
Sales Coverage as a Reporting Variable, Not Just an Operational One
Sales coverage analysis usually gets treated as an operations question rather than a reporting one, but it belongs in both. A lead generated overnight relative to the covering sales team's time zone will show a longer time-to-first-response in the data, and if that lag is not labelled as a coverage gap, it reads instead as a lead quality problem, which sends the wrong signal to whoever is deciding where to invest next.
Reports that track time-to-first-response by region, alongside the standard funnel metrics, make coverage gaps visible as a coverage issue rather than letting them masquerade as a targeting or creative problem.
MarTech Integration: Where Normalisation Actually Happens
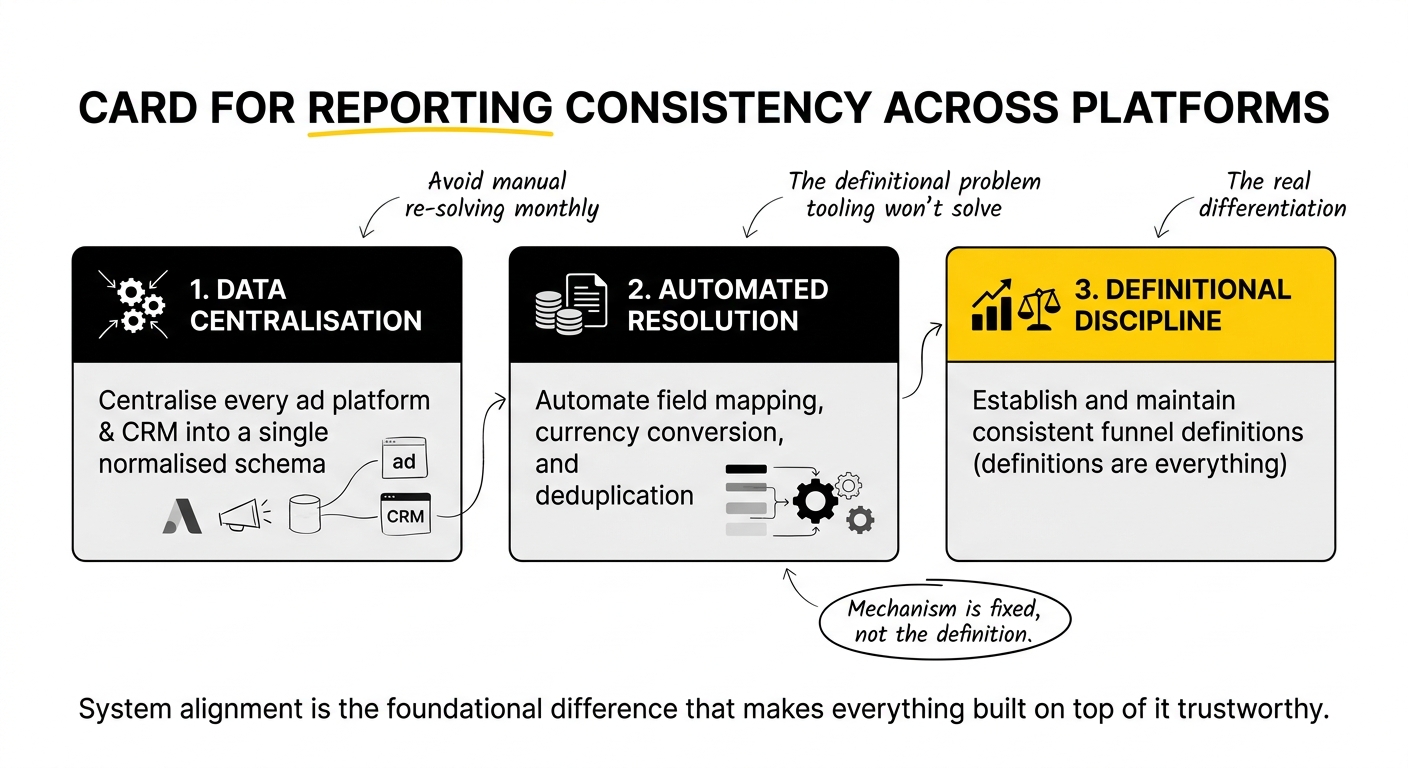
Mar-tech integration is where all of the above either gets resolved once, upstream, or gets re-solved manually every reporting cycle. Marketing analytics solutions that centralise data from every ad platform and the CRM into a single normalised schema, handling currency conversion, field mapping, and deduplication automatically, remove the need for someone to reconcile these differences by hand each month.
The integration choice matters less than the discipline behind it. A tool that normalises currency and field names but is fed inconsistent funnel definitions will still produce a misleading report. The tooling solves the mechanical problem. It does not solve the definitional one.
Marketing Operations Best Practices for Multi-Region Reporting
Marketing operations best practices for this kind of reporting come down to documenting decisions before building dashboards, not after. Reporting challenges in saas rarely come from bad tools. They come from unstated assumptions: which currency method is in use, which region's funnel definitions apply, whether maturity has been accounted for.
A durable multi-region reporting framework should document:
- The currency normalisation method in use, and why, for each report type
- Each region's funnel stage definitions, with any deliberate differences labelled rather than blended
- The attribution window applied per region, and the reasoning behind any difference
- A standard for flagging regional maturity so newer markets are not judged against mature-market benchmarks
Common Pitfalls in Multi-Region Reporting
A few patterns show up repeatedly:
- Blending funnel definitions without labelling them. Adding two different definitions of “qualified lead” together produces a number that means nothing.
- Comparing efficiency metrics across markets at different maturity stages. A newer market will look inefficient by comparison even when it is performing exactly as expected.
- Applying one global attribution window. Sales cycle length varies enough across regions that a single window misrepresents at least one market.
- Treating currency conversion as a settled choice. Spot rate and constant currency answer different questions, and reports rarely specify which one they are using.
- Reading coverage gaps as performance problems. A slow time-to-first-response caused by time zone misalignment is not the same issue as a genuinely weak lead.
Building a Comparable Reporting Framework
None of this requires abandoning a single dashboard in favour of three disconnected regional reports. It requires the dashboard to make its assumptions visible: which currency method is in play, which funnel definitions are being compared, and where maturity differences are being adjusted for rather than ignored.
This is a narrower problem than the broader question of how to scale campaigns across the UK, EU, and US, or the practicalities of running a global SaaS operation from a single base. Those questions cover strategy and operations. What matters here specifically is whether the numbers reported out of that strategy can actually be compared to one another without misleading whoever is reading them. Choosing a UK/EU SaaS PPC Agency for Google Ads Scaling touches on what consistent reporting should look like once an agency is managing spend across multiple markets, and Running Global SaaS Campaigns from a UK Base goes deeper into the operational side of that same multi-region setup.
If your team is working through how to make multi-region paid media reporting genuinely comparable, tied to your saas analytics setup or otherwise, that is a conversation worth having before the next quarterly report goes to the board.
Frequently Asked Questions
What are the challenges of normalizing paid media reporting across multiple regions in a SaaS context?
The main challenges are currency conversion method, inconsistent funnel definitions between regions, differing regional maturity levels, and attribution windows that do not match actual sales cycle length in each market. Each can make numbers technically comparable while still being misleading.
How can varying currencies impact paid media reporting for SaaS companies?
Spot-rate conversion reflects actual spend in the moment but can make a region look like it improved or declined purely due to currency movement. Constant-currency reporting strips out that movement for trend comparisons. Using the wrong method for the question being asked produces a misleading report.
What methodologies can be used to ensure data integrity in multi-region paid media reporting?
Standardise field names across platforms before data reaches the dashboard, document each region's attribution window and the reasoning behind any difference, and flag any change to funnel definitions so shifts in reported numbers are not mistaken for performance changes.
How do funnel definitions differ across regions in a SaaS environment?
Regions often define stages like “qualified lead” differently based on local sales process, for example, a call-booked threshold in one market versus a lead-scoring threshold in another. Blending these definitions without labelling them produces a combined number that does not represent either region accurately.
What best practices can help streamline paid media reporting processes for Tech-Savvy Marketing Operations Specialists?
Document the currency method, funnel definitions, and attribution windows in use before building dashboards, not after discrepancies appear. This turns reporting from a monthly reconciliation exercise into a documented, repeatable process.
How can seamless integration with existing MarTech stacks improve paid media reporting?
Centralising data from ad platforms and the CRM into one normalised schema removes the need to manually reconcile field names, currencies, and deduplication each reporting cycle. It solves the mechanical problem, though it does not resolve funnel definition differences on its own.
What role does regional maturity play in SaaS paid media reporting?
A newer market will typically show a higher cost-per-lead and lower conversion rate than a mature market, independent of how well campaigns are run, because more of its spend goes toward category education. Comparing markets at different maturity stages without adjusting for this produces a misleading performance picture.
How can attribution accuracy be enhanced across platforms in a multi-region SaaS context?
Match attribution windows to each region's actual sales cycle length rather than applying one global standard, and resolve deduplication across platforms so a single buyer journey spanning multiple regional campaigns is not counted as a conversion in more than one report.
What are the key metrics to consider when reporting paid media performance across different regions?
Cost-per-opportunity and pipeline contribution, adjusted for regional maturity and reported with a clearly stated currency method, give a more accurate cross-region picture than raw cost-per-lead or conversion count alone.
How can Marketing Operations Specialists reduce operational burdens in multi-region paid media reporting?
Document reporting assumptions once, currency method, funnel definitions, attribution windows, rather than re-deriving them manually every reporting cycle, and use a MarTech integration that automates the mechanical normalisation so the manual effort goes toward the definitional decisions that actually require judgement.