Harnessing Cohort Analysis to Enhance SaaS Paid Media Campaigns
Learn how to use cohort analysis to identify profitable segments and optimise your SaaS paid media campaigns, reducing CAC effectively.

Your paid media team is optimizing for clicks and conversions. Your sales team is tracking deals won. Your analytics team is measuring retention. But nobody's connecting these dots. You don't know if the users acquired from high-intent keywords have better retention than those from brand awareness campaigns. You don't know if users who convert quickly have higher lifetime value than those who take three months to decide. You're missing the insights that actually matter: which segments of users are most profitable, and which campaigns bring in the users most likely to stick around and expand.
Cohort analysis is the tool that connects these dots. By grouping users by their acquisition source, acquisition date, or behavior, you can track how different segments perform over time. You can see which campaigns drive not just conversions, but conversions that matter. You can identify profitable customer segments and reallocate budget accordingly. You can reduce Customer Acquisition Cost without cutting the channels that drive your best customers. This article covers how to implement cohort analysis systematically in your SaaS paid media operations, addressing the specific challenges that marketing operations specialists face: data silos, attribution accuracy, and integration complexity. To execute cohort analysis effectively, you need robust SaaS analytics solutions that can track user behavior from acquisition through expansion. Tools like Supermetrics enable you to scale efficiently with data-driven marketing by automating data collection and analysis. And once you've identified your most profitable cohorts and optimized accordingly, you'll be well-positioned to understand strategies for improving CAC without cutting strategic channels as you scale. Cost Per Acquisition (CPA) - The Most Critical PPC Metric, also on this blog, takes this further.
What Cohort Analysis Is (And Why It Matters for Paid Media)
A cohort is a group of users who share a common characteristic or experience within a defined time period. Cohort analysis is the practice of segmenting these groups and tracking their behaviour over time.
Example: all users acquired from Google Ads in January 2026 form a cohort. All users acquired from LinkedIn in January 2026 form a different cohort. By comparing these two cohorts month-by-month, you can see: in month one after acquisition, how many are still active? In month three? How much revenue did each cohort generate by month six?
This is fundamentally different from aggregate reporting. Aggregate reporting tells you: "In January 2026, we acquired 500 users and generated £50k in revenue." That's useful for high-level tracking, but it doesn't tell you which users are valuable. Cohort analysis tells you: "Of the 500 users acquired from Google Ads in January, 40% are still active in month three, and they've generated £80 in average revenue each. Of the 300 users acquired from LinkedIn in January, 60% are still active in month three, and they've generated £120 in average revenue each." Now you know which channel is bringing in more valuable users, even if it costs more per acquisition.
For paid media operations, cohort analysis unlocks three critical capabilities:
First, you can measure true CAC. Most teams calculate CAC as total spend divided by conversions. But conversion doesn't equal value. If you spent £1,000 and acquired 100 users, your CAC is £10. But if only 20 of those 100 users activate or convert to paid, your actual CAC for valuable customers is £50. Cohort analysis reveals this by tracking which users actually become valuable customers.
Second, you can identify profitable segments. Some campaigns drive high-volume, low-quality traffic. Some drive low-volume, high-quality traffic. Your job as marketing operations is to figure out which is which. Cohort analysis does this by comparing retention, engagement, and revenue across cohorts acquired from different sources.
Third, you can optimize budget allocation. Once you know which segments are most valuable, you can reallocate budget to the channels bringing in high-value users. This doesn't necessarily mean cutting spend on high-volume channels. It means intelligently shifting budget from low-quality sources to high-quality sources.
Setting Up Cohorts: Dimension, Time Period, and Metric
Before you can analyze cohorts, you need to define them. This means choosing three things: the dimension that defines the cohort, the time period, and the metrics you'll track.
Dimension: What characteristic do users in the cohort share? Common dimensions for paid media include:
Acquisition source (Google Ads, LinkedIn, Facebook, Display, etc.), acquisition campaign (high-intent keywords, brand awareness, competitor capture, etc.), acquisition date (weekly, monthly, quarterly cohorts), user characteristics (job title, company size, industry, if you have this data), or initial behaviour (users who completed onboarding within 24 hours vs. those who didn't).
For paid media specifically, acquisition source and acquisition campaign are the most useful dimensions. You want to compare how users from different campaigns perform over time.
Time period: How granular should your cohorts be? Weekly cohorts give you more granular data but are noisier (smaller sample sizes). Monthly cohorts are more stable but take longer to reveal trends.
For most SaaS companies, monthly cohorts are the standard. They're large enough to smooth out daily volatility, but recent enough that you can act on insights without waiting months for data.
Metrics: What will you measure for each cohort? Common metrics include activation rate (% of users who completed a key milestone within X days of signup), retention rate (% of users still active in month 2, 3, 6, 12), expansion rate (% of free users who upgraded to paid, or % who increased their plan), average revenue per user (ARPU) in each month after acquisition, churn rate (opposite of retention), or net revenue retention (total revenue from a cohort in month X divided by total revenue in month X-1).
Choose metrics that align with your business model. If you're a free-to-paid SaaS, track activation and upgrade rates. If you're a usage-based SaaS, track engagement and ARPU. If you're B2B with annual contracts, track retention and expansion.
Building Your Cohort Analysis Framework
Once you've defined your cohorts, you need a systematic way to track them over time. This requires:
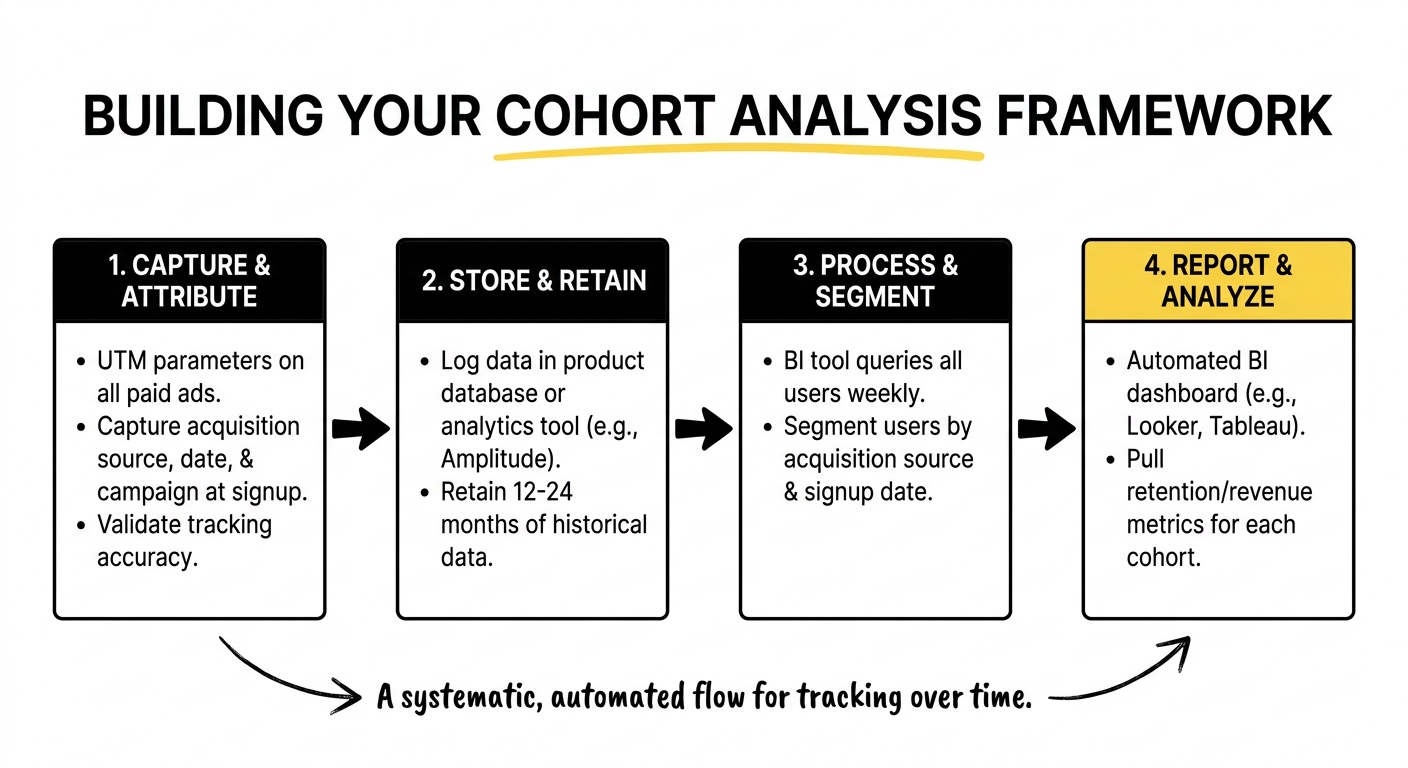
Data infrastructure: You need to capture acquisition source at the user level and store it in a way you can query later. This usually lives in your analytics tool (Amplitude, Mixpanel, Segment) or your product database. The key requirement: when a user signs up, you log their acquisition source, date, and campaign. Everything else flows from that.
Attribution accuracy: The biggest challenge in cohort analysis is ensuring you've correctly attributed each user to their acquisition source. This requires UTM parameters on all paid ads, consistent naming conventions, and validation that your tracking is working. If 20% of your users have missing or incorrect source data, your cohorts will be misleading.
Retention of historical data: Cohort analysis requires looking back. You need data on users from months ago to understand how they're performing now. Make sure your analytics tool or database keeps historical data long enough to track cohorts through their full lifecycle (typically 12-24 months for SaaS).
Automated reporting: Manually pulling cohort data every month is tedious and error-prone. Use your analytics tool's built-in cohort reporting (Google Analytics has this), or build a BI dashboard (Looker, Tableau) that automatically updates your cohorts weekly or monthly.
A simple setup might look like this: users sign up via a paid ad, UTM parameters capture source and campaign, your product logs the source in the user record, weekly, your BI tool queries all users, segments them by acquisition source and signup date, you can then pull retention/revenue metrics for each cohort.
More sophisticated setups integrate CRM data (to track conversions), billing data (to track revenue), and support data (to track churn reasons).
Analyzing Cohorts: From Data to Insights
Once you're collecting cohort data, the next step is analyzing it to answer specific questions about your paid media performance.
Question 1: Which acquisition sources drive the highest-quality users?
Pull retention data for each major acquisition source over 6-12 months. Create a retention curve: month 0 is signup (100%), month 1 might be 70%, month 2 might be 55%, month 3 might be 45%, etc. Compare these curves across sources.
If Google Ads users have a steeper drop-off than LinkedIn users, that suggests Google Ads is bringing in lower-quality users. If they have similar retention but LinkedIn has higher ARPU, that suggests LinkedIn users are more valuable even if they cost more per acquisition.
Question 2: Which campaigns drive the most profitable segments?
Do the same analysis but at campaign level, not just channel level. You might find that within Google Ads, high-intent keyword campaigns drive 60% retention at month 3, while brand awareness campaigns drive 30% retention. This is a signal to reallocate budget within Google Ads.
Question 3: Are my recently acquired users better or worse than users from 6 months ago?
Pull cohorts from different months and overlay them. Are recent cohorts activating faster? Are they retaining longer? This tells you whether your targeting and messaging are improving over time.
Question 4: What's the true CAC for each segment?
Take acquisition cost and divide by the % of users who actually became valuable (activated, converted to paid, etc.). Example: Google Ads cost £10 per signup, but only 30% activate. True CAC for activated users is £33. LinkedIn cost £20 per signup, but 60% activate. True CAC for activated users is £33. They look the same on raw CAC, but this breakdown reveals the reality.
Question 5: Which segments have the best LTV to CAC ratio?
Calculate LTV for each cohort (total revenue generated divided by number of users). Divide by CAC. A ratio above 3:1 is generally healthy. A ratio below 1:1 is unsustainable.

Overcoming Common Implementation Challenges
Cohort analysis sounds simple in theory. In practice, marketing operations teams face obstacles.
Challenge One: Missing or inaccurate attribution data.
Many users arrive without proper UTM parameters, or with incorrect ones. This creates gaps in your cohort data.
Solution: Audit your UTM implementation first. Check a sample of 100 recent signups. What percentage have correct source data? If it's below 80%, fix your tracking before building cohorts. Implement validation rules in your form so you can't submit a signup without source data. For existing data, accept the imperfection. You won't have perfect cohorts, but directionally correct cohorts are better than no cohorts.
Challenge Two: Data silos between systems.
Your analytics tool doesn't talk to your CRM. Your billing system is separate. Your support system has churn data nobody's connected to acquisition source.
Solution: Start with one system. Build cohort analysis in your analytics tool using activation and engagement metrics. Once that's working, layer in CRM data (conversion rates). Then layer in billing data (revenue). You don't need a perfect, integrated system. You need directionally correct insights you can act on.
Challenge Three: Cohort sizes are too small.
If you're running 20 campaigns, each cohort might have 50 users. That's a small sample size, and monthly variance can be high.
Solution: Aggregate cohorts temporarily for analysis. Group campaigns by channel (all Google Ads campaigns together) and analyze by channel. Once you see patterns, zoom into specific campaigns. This approach reduces noise and makes trends clearer.
Challenge Four: Cohort analysis reveals problems you can't immediately fix.
You discover that users from your highest-spend channel have terrible retention. But you can't kill the channel immediately because lead volume would drop.
Solution: Use cohort analysis to inform iterative changes, not binary decisions. If Google Ads users have 40% month-3 retention and LinkedIn users have 60%, don't cut Google Ads. Instead, increase budget for LinkedIn while running tests to improve Google Ads quality (different targeting, different messaging, different landing pages). Cohort data guides the direction of change.
Challenge Five: Stakeholders don't trust the data.
Sales says your cohort data showing high churn is wrong. Finance questions your CAC calculations because they're different from reported metrics.
Solution: Show your work. Publish your cohort methodology: how you're defining cohorts, how you're calculating metrics, what data sources you're using, and what gaps exist. Let stakeholders challenge the methodology. Once everyone agrees on how cohorts are built, the data becomes a shared source of truth.

Putting Cohort Analysis Into Practice: A Three-Month Roadmap
Here's how to implement cohort analysis at your organization:
Month 1: Audit and Plan. Audit your current data capture. Are you logging acquisition source at the user level? What % of users have attribution data? Do your analytics tool, CRM, and billing system have the data you need for cohorts? Document gaps. Create a project plan. Which cohort dimension will you start with (source, campaign, or date)? Which metrics matter most? What time period (monthly cohorts)?
Month 2: Build the System. Implement tracking or connect existing systems. Set up automated cohort reporting in your analytics tool or BI dashboard. Create your first cohort report showing retention by acquisition source over 6-12 months. Share with your team. Iterate on the format based on feedback.
Month 3: Analyze and Act. Pull cohort insights. Which sources/campaigns drive the best users? Which have the highest churn? Which have the best LTV to CAC ratio? Present findings to your marketing team. Together, decide: should we reallocate budget? Should we change targeting or messaging? What tests should we run based on cohort insights?
Month 3 and beyond: make cohort analysis a monthly operational rhythm. Review cohorts at the same time each month. Track whether budget reallocations are improving overall performance. Continuously refine your cohort definitions and metrics.
Frequently Asked Questions
What is cohort analysis and how can it be applied to SaaS paid media campaigns?
Cohort analysis is the practice of segmenting users who share a common characteristic (e.g., acquisition source, signup date) and tracking their behaviour over time. For paid media, you typically segment by acquisition channel or campaign, then track retention, activation, and revenue for each segment. This reveals which campaigns drive high-quality users and which drive volume without value.
How does cohort analysis help in identifying profitable customer segments for SaaS businesses?
Cohort analysis reveals segment profitability by comparing retention, activation rate, and lifetime value across cohorts acquired from different sources. A segment with 50% month-3 retention and £100 ARPU is more profitable than a segment with 20% retention and £50 ARPU, even if the second segment has lower acquisition costs. This guides budget allocation toward high-profit segments.
What metrics should be considered when using cohort analysis to evaluate campaign performance?
Key metrics include activation rate (% reaching a key milestone), retention rate (% still active in month 2, 3, 6), expansion rate (% who upgrade or increase spend), average revenue per user, churn rate, and net revenue retention. Choose metrics aligned with your business model. For free-to-paid SaaS, focus on activation and upgrade rates. For expansion-focused SaaS, focus on retention and ARPU growth.
How can cohort analysis reduce Customer Acquisition Cost (CAC) in SaaS marketing?
Cohort analysis reveals true CAC by showing which users actually become valuable. Raw CAC is total spend divided by signups. True CAC is total spend divided by valuable signups (those who activate, convert, or retain). By identifying which sources drive higher-value users, you can reallocate budget from low-quality sources to high-quality sources, reducing your true CAC without necessarily cutting volume.
What are the best practices for ensuring data integrity in cohort analysis?
Best practices include: capturing acquisition source at user signup (via UTM parameters), logging it consistently in your analytics tool or product database, validating that tracking is working (spot-check samples), retaining historical data for 12-24 months, and documenting your cohort definitions and calculation methods. Accept that perfect data is rare. Focus on directionally correct data you can trust.
How can attribution accuracy be improved when using cohort analysis in paid media?
Implement consistent UTM parameter naming conventions across all paid ads. Validate that UTM parameters are flowing into your analytics tool. Spot-check samples of users to ensure source data is correct. Use multi-touch attribution if available (giving credit to multiple touchpoints rather than just the last click). Accept that some users will have missing data. Focus on the users with clean attribution to draw insights.
What tools and technologies can integrate cohort analysis into existing MarTech stacks?
Most analytics tools (Amplitude, Mixpanel, Google Analytics) have built-in cohort reporting. BI tools (Looker, Tableau, Metabase) can pull raw user data and build cohort dashboards. CRM platforms (Salesforce, HubSpot) can segment users by acquisition source. The key is connecting these systems so user-level data flows from analytics to CRM to billing. Start with the tools you have. Add integrations only if they solve specific problems.
How can cohort analysis inform marketing strategies for different customer segments?
Once you identify high-value and low-value segments via cohort analysis, you can tailor strategies for each. For high-value segments, increase budget and protect margins. For low-value segments, either improve targeting/messaging to increase quality, or reallocate budget elsewhere. For segments with high activation but low retention, focus on onboarding improvements. Each insight from cohort data can drive a specific strategic change.
What common mistakes should be avoided when implementing cohort analysis in paid media campaigns?
Common mistakes include: tracking attribution inconsistently (missing UTM parameters), building cohorts with small sample sizes (too granular), waiting for perfection in data (instead of acting on directionally correct insights), ignoring cohort churn reasons, and making dramatic budget cuts based on single cohort insights (instead of iterating). Avoid these by validating data quality upfront, aggregating cohorts sensibly, acting on insights incrementally, and investigating why cohorts churn.
How can cohort analysis be used to track customer lifetime value (CLV) in SaaS businesses?
Cohort analysis reveals CLV by showing total revenue generated by a cohort over their lifetime, divided by number of users in the cohort. Track this month-by-month: in month 1, cohort CLV might be £20 per user. By month 12, it might be £300 per user. Compare CLV across cohorts acquired from different sources. If one source has higher CLV, that's a signal to invest more there. Over time, CLV trends reveal whether your business is becoming more efficient at retaining and expanding customers.