Mastering Demand Generation for Long Sales Cycles in B2B SaaS
Explore strategies for effective demand generation in B2B SaaS, addressing long sales cycles and complex buying committees. A guide for data-driven CMOs.

Your attribution dashboard shows a healthy pipeline. Demo requests are coming in. But three months from first touch, the board wants to know where the revenue is.
This is the fundamental tension in B2B SaaS demand generation. The metrics that are easiest to report rarely reflect what is actually driving pipeline. And in a world where enterprise buying committees have grown from 5.4 stakeholders in 2020 to 8-12 today, and the average sales cycle has stretched to 134 days, the disconnect between marketing activity and board-ready outcomes is only getting harder to close.
Planning demand generation strategies for long sales cycles requires a different operating model. Not a harder one. A more honest one.
This guide covers how to build that model: from structuring your approach for buying committees to measuring what matters when deals take six months to close.
Why Long Sales Cycles Break Standard Demand Generation Frameworks
Most demand generation frameworks were designed for a simpler buying environment. One champion. A decision made in weeks. A form fill that reliably predicted revenue.
That environment barely exists in B2B SaaS anymore. B2B buyers now complete 70-80% of their research before ever engaging with sales (Forrester, 2025). By the time someone submits a demo request, they have already formed a view of your product based on conversations your attribution stack never saw.
The structural forces making cycles longer are not temporary. Sales cycles have lengthened 22% since 2022, driven by larger buying committees, increased security and compliance requirements, and buyers with more comparison tools available than ever before. CFO involvement in software purchases increased 40% over the same period.
The implication for demand generation is uncomfortable but important: the campaigns you are running today are influencing deals that will not close for six months or more. Planning that ignores this reality produces dashboards that look healthy and pipelines that disappoint.
There are three planning errors that flow directly from this mismatch.
Optimising for short-cycle metrics. Measuring demand gen on MQL volume and cost per lead treats every marketing touch as if the deal closes next week. In enterprise SaaS, you are funding awareness and consideration phases whose value will not appear in the CRM for quarters.
Treating all stakeholders as one buyer. A VP of Engineering, a CFO, and a Head of Security all have different objections, different content needs, and different thresholds for moving forward. Demand generation built for one persona will stall when it reaches the others.
Skipping upper-funnel investment. Teams under short-term performance pressure strip out brand and awareness spend because it is hard to attribute. The result is a demand capture machine competing for the same in-market 3-5% of buyers as every competitor, with nothing creating demand among the 95% who are not yet looking.
Building a Demand Generation Framework for Buying Committees
The core planning question for SaaS CMOs is not “what campaigns should we run” but “who in the buying committee needs to know what, at what stage of their journey.”
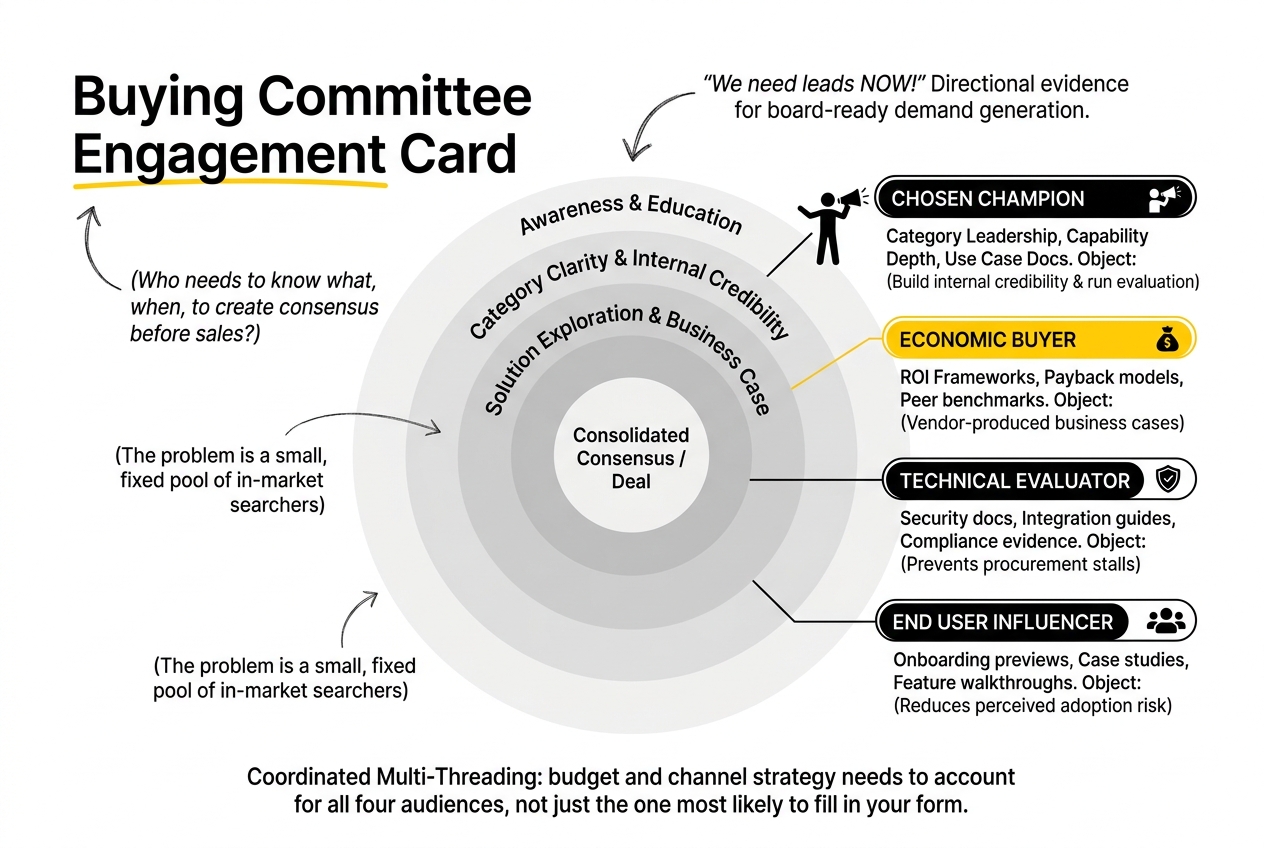
A buying committee at a mid-market or enterprise SaaS target typically includes: a business champion (often a VP or Director in the functional area you are solving for), a technical evaluator (engineering, IT, or security), an economic buyer (CFO or CEO), a procurement or legal contact, and one or more end users who will influence adoption post-sale.
These roles rarely align on timeline. The champion may be ready to move in month two. The economic buyer may not engage until month five. Legal may add three weeks at the end. Demand generation designed around the champion’s journey will miss everyone else.
Map Content to Committee Roles, Not Just Funnel Stages
Funnel stages (awareness, consideration, decision) are a useful internal shorthand, but they describe the organisation’s pipeline stage, not the individual buyer’s readiness.
A more useful planning approach is to map content and channel investment against committee roles and their specific objections:
- Champion content: Category-level thought leadership, product capability depth, use case documentation. Helps them build internal credibility and run the evaluation.
- Economic buyer content: ROI frameworks, payback period models, peer benchmarks. Gartner data shows that B2B buyers increasingly want vendor-produced business cases rather than building their own from scratch.
- Technical evaluator content: Security documentation, integration guides, compliance evidence. This is content that rarely appears in attribution models but regularly surfaces during procurement stalls.
- End user content: Onboarding previews, case studies from similar teams, feature walkthroughs. Reduces perceived adoption risk.
The planning implication: budget and channel strategy needs to account for all four audiences, not just the one most likely to fill in your form.
Multi-Threading Is a Marketing Problem, Not Just a Sales Problem
Sales teams are taught to multi-thread: engage multiple stakeholders early so the deal does not die with one contact. Demand generation can support this directly.
Paid social targeting on LinkedIn allows committee-level targeting by function, seniority, and company. A well-structured account-based marketing programme can serve different content to the VP of Engineering and the CFO at the same target account, creating the conditions for internal consensus before sales has a single conversation.
This is one area where coordinating demand generation and demand capture strategies matters most. The upper-funnel education work that reaches the economic buyer six months before a demo request is the same work that prevents the deal from stalling when the CFO asks “why now.”
Data-Driven Approaches to SaaS Demand Generation: Metrics That Hold Up
The metrics challenge in demand generation for long sales cycles is straightforward: if you measure only what attribution software can see, you will optimise for the wrong thing.
Traditional attribution captures roughly 30% of the buyer influence chain in B2B SaaS. The rest happens in channels that do not generate trackable clicks: Slack conversations, LinkedIn DMs, peer network recommendations, podcast mentions, and AI assistant queries. This is what Refine Labs describes as the dark funnel, and it is not a niche problem. Direct traffic accounts for 70%+ of site visits at major SaaS platforms including HubSpot and Salesforce, most of which is dark funnel activity misattributed to “Direct” or “Organic Search.”
Running demand gen on attribution data alone means optimising for the visible 30% while the 70% that actually drove the conversation sits uncounted.
The Measurement Stack for Long-Cycle Demand Gen
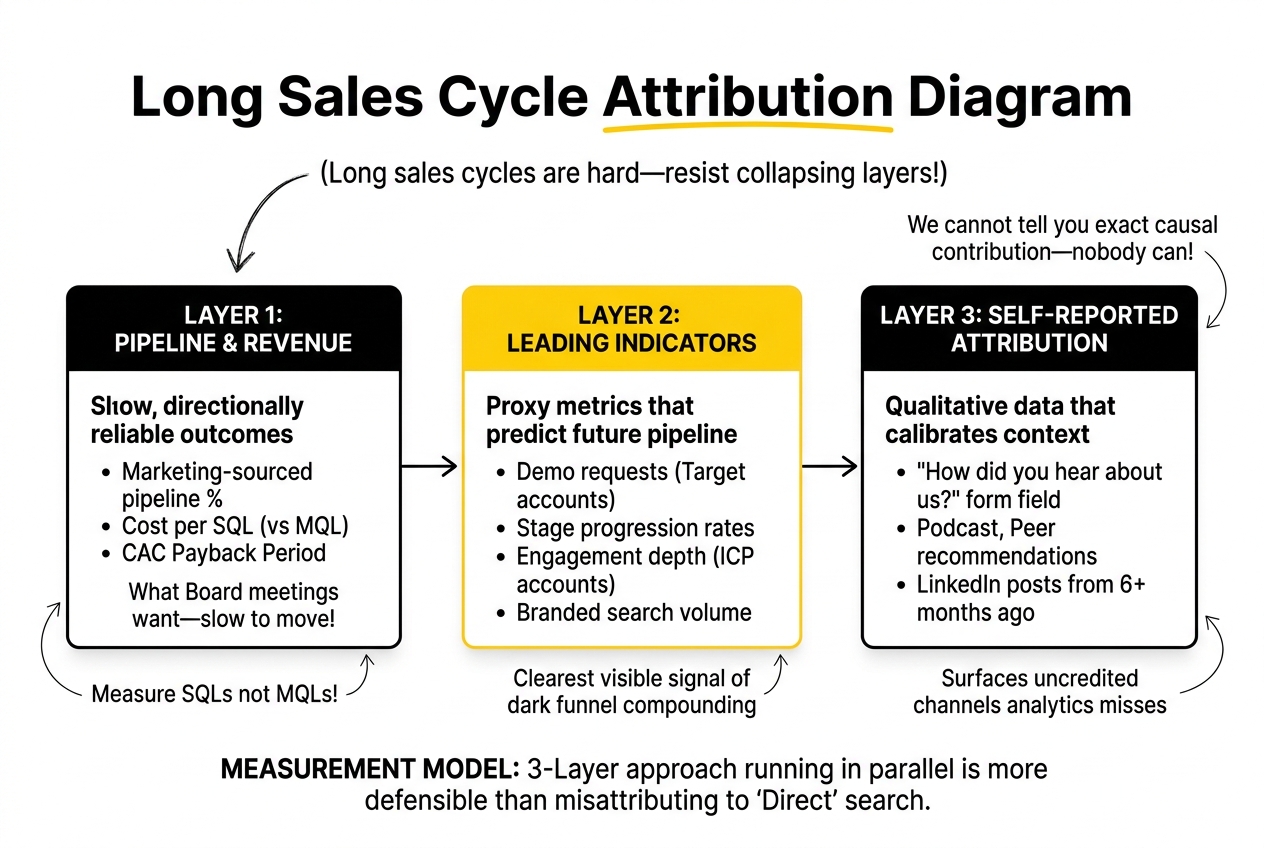
A measurement model that works across 90-180 day sales cycles requires three layers operating in parallel.
Layer 1: Pipeline and revenue metrics. The only number that holds up in a board meeting. Track marketing-sourced pipeline as a percentage of total new pipeline (benchmark: 30-55% for well-developed demand gen programmes), cost per SQL rather than cost per MQL, and CAC payback period. These are slow to move but directionally reliable.
Layer 2: Leading indicators. Proxy metrics that predict pipeline before it appears in the CRM. Demo requests from target accounts, stage-to-stage progression rates, engagement depth from ICP-matching accounts, and branded search volume. Rising branded search without a paid brand campaign is often the clearest visible signal of dark funnel activity compounding.
Layer 3: Self-reported attribution. Add a free-text “How did you hear about us?” field to every demo request form. The answers will consistently surface channels that analytics never credits: a podcast, a peer recommendation, a LinkedIn post from six months ago. This is qualitative data, but it calibrates your interpretation of the quantitative layer.
The temptation at board level is to collapse these three layers into a single attribution number. Resist it. The honest position is: “We have directional confidence in our demand gen investment based on pipeline contribution, leading indicators, and self-reported data. We cannot tell you the precise causal contribution of each channel because nobody can.”
That framing is more defensible than a last-touch attribution model that systematically misattributes pipeline to Google because that is where buyers clicked before submitting a form.
Balancing Brand Positioning and Performance in Demand Generation
Most SaaS marketing organisations face a version of the same internal argument: brand programmes are hard to measure, performance programmes have clear attribution, so performance gets the budget.
The problem with this logic is that performance channels only capture demand that already exists. In a long-cycle SaaS market with a defined ICP and a limited total addressable market, demand capture has a ceiling. At some point you have reached everyone who is currently searching for your category. To grow past that ceiling, you have to create demand among buyers who are not yet looking.
This is not an argument for prioritising brand over performance. It is an argument for understanding which part of your growth problem each type of investment solves.
Establishing Budget Guardrails
Rather than running brand and performance as competing priorities for the same budget, a more useful planning approach is to set floor allocations for each based on their role in the pipeline:
- Demand capture (paid search, intent-based targeting, competitor campaigns): Responsible for converting existing in-market demand. Measured on cost per SQL and pipeline contribution. Typically 40-60% of demand gen budget in mature programmes.
- Demand creation (paid social, content, organic, community, thought leadership): Responsible for building category awareness and future pipeline among buyers not yet searching. Measured on leading indicators and pipeline cohorts over 12-18 month windows. Typically 40-60% of demand gen budget in mature programmes.
The exact split depends on the maturity of the programme, the size of the ICP, and how saturated the demand capture channels are. A company early in its growth cycle with a large untapped ICP should lean toward demand creation. A company in a competitive category with established brand presence should invest heavily in capture.
What both require is a commitment to holding the investment period. Demand creation programmes take 6-12 months to produce attributable pipeline. Cutting them at month three because attribution is unclear is the single most common way SaaS marketing teams starve the future pipeline they are being asked to build.
Content Strategy for Long Sales Cycles and Complex Buying Committees
Content marketing in long-cycle B2B SaaS is not primarily about generating leads. It is about doing the education work that buying committees need to complete before they can make a decision.
This reframe matters because it changes what you create and where you distribute it.
Most SaaS content strategy is built around top-of-funnel blog posts and gated whitepapers. The blog posts target keywords. The whitepapers generate MQLs. Neither does much for the CFO who is six weeks into evaluating three vendors and needs to understand the business case, or the Head of Security who needs to know whether the platform is SOC 2 compliant before she will let the deal proceed.
Content Mapped to Cycle Stage
Early stage (0-30 days from first touch): Category-level education. Thought leadership that reaches buyers before they are actively evaluating. LinkedIn posts, podcast appearances, industry research. This is content that does not generate form fills but seeds the consideration that produces inbound later.
Mid stage (30-90 days): Evaluation support. Comparison content, detailed use case documentation, integration guides, customer case studies from similar companies. The champion is building their internal case. Your content needs to help them make it.
Late stage (90+ days): Decision support. Security documentation, ROI calculators, reference calls, executive briefings. This is the content that gets pulled into procurement review. If it does not exist, deals stall waiting for it.
Most SaaS content strategies are heavy on early-stage content and almost entirely absent from the late-stage assets that actually unblock deals. Auditing your content library against these three phases will usually reveal where the gaps are.
Attribution Modelling for Multi-Stakeholder Environments
Attribution in a long-cycle, multi-stakeholder buying environment is not a solved problem. Any vendor claiming otherwise is selling certainty that does not exist.
The practical question is not “how do we get perfect attribution” but “how do we make better decisions than we would with no attribution model at all.”
For most SaaS CMOs operating with 90-180 day sales cycles, a workable attribution approach combines three inputs:
- CRM-connected multi-touch attribution: Connects marketing touches to pipeline and closed-won revenue across the full cycle. Better than last-touch alone, though it still misses dark funnel influences. HubSpot and Salesforce both support this natively when configured correctly.
- Cohort analysis: Rather than attributing individual deals, track cohorts of accounts by the month they first engaged with marketing. How does a cohort of accounts that consumed three pieces of content compare to accounts that consumed one? What is the pipeline velocity difference? Cohort analysis reveals patterns that deal-level attribution obscures.
- Self-reported data: As covered above. Qualitative, but directionally reliable. Consistently surfaces channels that quantitative attribution misses.
The board narrative that comes from this combination is more defensible than one built on last-touch alone: “Marketing-sourced pipeline represents 42% of new pipeline this quarter. Our cohort analysis shows accounts that engaged with demand creation content in Q1 are now entering active evaluation. Self-reported data confirms LinkedIn and our podcast are the primary pre-form-fill influences.”
That is a CMO narrative that holds up to scrutiny. It is also honest about what attribution can and cannot tell you.
Optimising Marketing for Buying Committees: Practical Steps
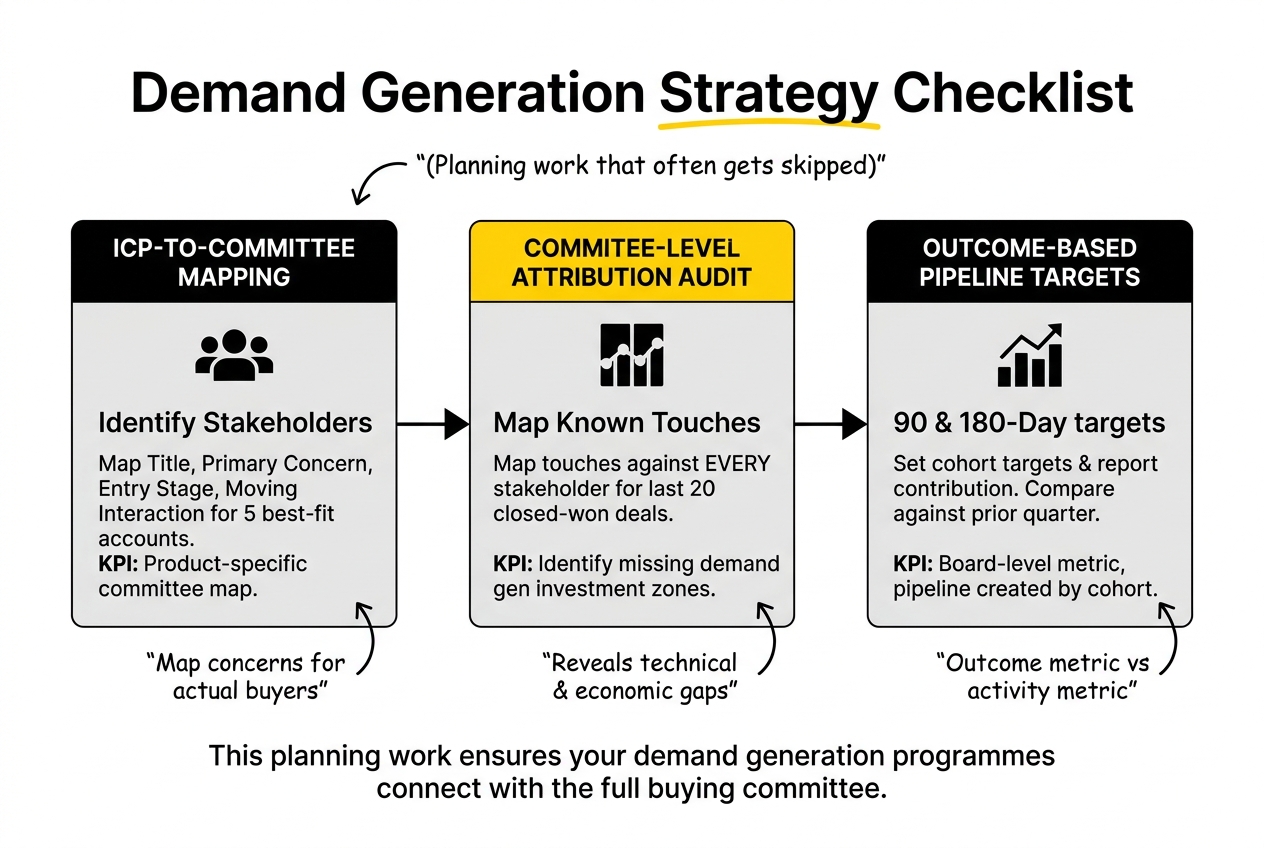
Planning work that often gets skipped but consistently improves demand gen outcomes for buying committee environments.
Run an ICP-to-committee mapping exercise. For your five best-fit closed-won accounts, identify every stakeholder who was involved in the decision. What was their title? What was their primary concern? At what stage did they enter the evaluation? What content or interaction moved them forward? This exercise produces a buying committee map that is specific to your product and market, which is worth far more than a generic framework.
Audit your attribution for committee-level gaps. Pull your last 20 closed-won deals and map every known marketing touch against every stakeholder involved. You will almost certainly find entire personas (frequently technical evaluators and economic buyers) with no marketing attribution, despite their clear involvement in the decision. Those gaps tell you where demand gen investment is missing.
Set 90-day and 180-day pipeline creation targets as board-level metrics. Rather than reporting on MQL volume, report on pipeline created by cohort. How much pipeline was created in the last 90 days that marketing can reasonably claim contribution to? How does that compare to the 90-day cohort from the prior quarter? This reframes the conversation from activity to outcomes while acknowledging that long cycles prevent in-period attribution.
Crafting Board-Ready Narratives for Demand Generation Investment
The hardest part of running demand generation for long-cycle SaaS is not building the programmes. It is explaining them to a board that wants to see ROI in the same quarter the investment was made.
A board-ready narrative does three things. It connects marketing investment to pipeline and revenue outcomes with whatever attribution confidence you have. It explains the investment thesis for demand creation spend that will not generate measurable returns for 6-12 months. And it establishes the leading indicators that will signal whether the investment is working before the pipeline appears.
The framing that tends to work: “We are running two parallel programmes with different measurement windows. Our demand capture programmes have clear, short-term attribution and are producing [X] of pipeline this quarter. Our demand creation programmes are building category awareness among accounts not yet in market. We expect pipeline contribution from this cohort in Q3. Here are the leading indicators we are tracking to confirm they are on track.”
This is not spin. It is an accurate description of how demand generation works across a long sales cycle. The CMOs who struggle in board settings are usually presenting demand gen as a single activity with a single measurement model. It is not. It is two fundamentally different types of investment with different time horizons, and presenting them separately is more accurate and more defensible.
Frequently Asked Questions
What are the key challenges of demand generation for SaaS companies with long sales cycles?
The three core challenges are measurement, attribution, and patience. Standard attribution models misattribute credit in long-cycle environments because buyers complete most of their research before engaging. Measurement models built for short cycles (MQLs, CPL) produce misleading signals. And the investment required to influence pipeline 6-12 months out demands patience from leadership that expects quarterly returns. The solution is a measurement model that combines pipeline cohort analysis, leading indicators, and self-reported attribution alongside standard attribution.
How can SaaS CMOs effectively manage buying committees in the demand generation process?
Start with committee mapping: identify every role involved in your typical enterprise decision and what their primary objection is at each stage. Then build content and channel strategy around each role, not just the primary champion. LinkedIn’s targeting capabilities allow committee-level reach in target accounts. ABM programmes can coordinate messaging across roles simultaneously, reducing the internal friction that stalls decisions.
What strategies can be employed to create a predictable growth engine in SaaS?
Predictable growth requires separating demand creation (building future pipeline among non-buyers) from demand capture (converting existing in-market demand). Both require sustained investment measured on different timeframes. Demand capture is predictable in the near term; demand creation becomes predictable over 6-12 month cohorts. Combining both, with defined floor allocations for each and clear leading indicators, is the foundation of a predictable growth model that holds up in board settings.
How does attribution work in multi-stakeholder environments for SaaS demand generation?
It does not work cleanly, and claiming otherwise creates more problems than it solves. A practical approach combines CRM-connected multi-touch attribution, cohort analysis at the account level, and self-reported attribution from demo request forms. Together these give directional confidence without overstating precision. The goal is to make better investment decisions than you would with no model, not to achieve certainty that the buying environment does not support.
What metrics should SaaS CMOs track to measure the success of demand generation efforts?
Marketing-sourced pipeline as a percentage of total new pipeline, cost per SQL, CAC payback period, and pipeline velocity are the board-level metrics that matter. For leading indicators: demo requests from ICP accounts, stage progression rates, branded search volume, and account-level engagement depth. MQL volume and cost per MQL are useful internal diagnostic metrics but should not be the primary board report.
How can SaaS companies balance brand positioning with performance in their demand generation strategies?
Set floor allocations for each rather than treating them as competing priorities. Demand capture (paid search, intent targeting) handles in-market buyers and produces near-term attribution. Demand creation (content, paid social, thought leadership, community) builds future pipeline and is measured on 12-18 month cohorts. The split depends on programme maturity and ICP size, but neither should fall below 30% of demand gen budget without a clear strategic rationale.
What role does content marketing play in SaaS demand generation for complex buying committees?
Content does the education work that buying committees need to complete before they can make a decision. The planning error most teams make is producing content that serves the champion but ignores the economic buyer, technical evaluator, and end users who also have veto power. Auditing your content library against the specific objections of each committee role will reveal which stages have gaps. Late-stage content, particularly security documentation, ROI frameworks, and business case templates, is consistently underinvested and consistently unblocks deals.
How can SaaS CMOs craft board-ready narratives to secure budget approvals for demand generation initiatives?
Present demand capture and demand creation as separate investment types with different measurement windows. Show current-quarter attribution for capture programmes. For creation programmes, present leading indicators and cohort trajectories. Establish the logic: “Accounts in this cohort engaged with category content in Q1 and are entering active evaluation in Q3.” Boards that understand the investment thesis accept slower attribution; boards that have never had it explained correctly will push back on anything that does not show same-quarter ROI.
What are best practices for establishing measurable guardrails for brand and performance in SaaS demand generation?
Set minimum floor allocations for both demand creation and demand capture investment, with documented rationale for the split. Define the leading indicators that will signal each programme is on track before pipeline appears. Review cohort performance quarterly rather than monthly, since short review cycles produce premature optimisation of long-cycle programmes. Establish agreement upfront on the time horizon for each investment type, so leadership expectations are calibrated before the work begins.
How can data-driven insights improve demand generation strategies for SaaS companies?
The highest-value data in long-cycle demand gen is often the data you are not collecting. Closed-won interviews with buying committee members, self-reported attribution from demo forms, and content consumption analysis by account reveal the actual influence chain that drove the decision. This qualitative layer, combined with pipeline cohort data from CRM, produces more accurate investment decisions than attribution models alone. The goal is directional confidence across all inputs, not false precision from a single attribution source.
Demand generation for long sales cycles is not a problem you solve once. It is a planning discipline you apply consistently: right metrics, right committee map, right time horizon. If you are working through how to structure this for your team, we dig into this kind of challenge with SaaS marketing leaders regularly. Worth a conversation if you are at that stage.