A Comprehensive Guide to Reporting Tools for Large SaaS Teams
How to evaluate reporting tools for large SaaS teams, with the governance, permissions, and audit trails that keep data trustworthy at scale.

At a ten-person company, reporting governance is informal and it works. One analyst owns the numbers, everyone trusts them, and if a figure looks odd you walk over and ask. None of that survives scale. In a large SaaS organisation, two teams pull "pipeline" and get different numbers, nobody can say which is correct or who last changed the definition, and a stakeholder who spots the gap quietly stops trusting the entire report.
That failure is rarely about the charts. The dashboards look fine. The problem is governance: who can see and change what, how each metric is defined, whether anyone can trace a number back to its source, and whether each audience gets a view they can actually rely on. Choosing reporting tools for SaaS teams at scale is less about which one draws the prettiest graph and more about which one enforces consistency across dozens of people who all touch the data.
This is a guide to evaluating reporting solutions for large SaaS teams with effective governance, written for the Marketing Operations Specialist who has to make the choice and live with it. It is deliberately not a feature checklist. The useful frame is this: a reporting tool does not fix weak governance, it scales it. Pick well and the tool enforces good discipline across the org; pick on visual polish alone and it will multiply your inconsistencies faster than you can reconcile them. For the wider measurement setup this sits inside, our saas analytics hub is the place to start.
Why governance is the real question at scale
Governance in SaaS reporting is the set of controls that keep data consistent and trustworthy as more people produce and consume it: permissions, agreed metric definitions, audit trails, and curated views. It is the dimension buyers most often underweight, because it is invisible in a demo and painfully visible six months into a rollout.
The specific failure at scale is metric drift. When "revenue", "qualified lead", and "pipeline" are defined inside individual dashboards rather than centrally, two reports can calculate the same metric differently with nothing flagging the inconsistency. Each looks authoritative. Neither is wrong in isolation. Together they destroy trust, because a leadership team that sees two pipeline numbers in one week stops believing both.
This is where data integrity in reporting actually lives. Not in whether a single number is correct today, but in whether the same definition produces the same number for everyone, every time, traceable back to who set it. For analytics tools serving sizable SaaS teams, that oversight is the whole point. The competitors that treat reporting-tool selection as a visualisation contest miss it entirely, and so do the teams who buy on the strength of a slick demo.
The four governance capabilities to evaluate
Strong governance in a reporting tool comes down to four capabilities. Evaluate every shortlisted tool against these before you look at a single chart type.
- Permissions. Role-based access that controls who can view which data and, more importantly, who can edit a metric definition versus only consume it. Row-level security so a regional team sees its own numbers without seeing everyone's.
- Metric definitions. A single governed definition of each metric, set centrally, so "pipeline" means one thing across every dashboard. This is the semantic or metric layer, and it is the difference between consistency by design and consistency by hope.
- Audit trails. A record of who changed which definition and when. When a number moves unexpectedly, audit trails answer what changed and who changed it in minutes rather than days, which matters for debugging and for any regulated reporting.
- Stakeholder-ready views. Curated, role-appropriate views so each audience sees a trustworthy slice without touching raw data or rebuilding the report themselves.
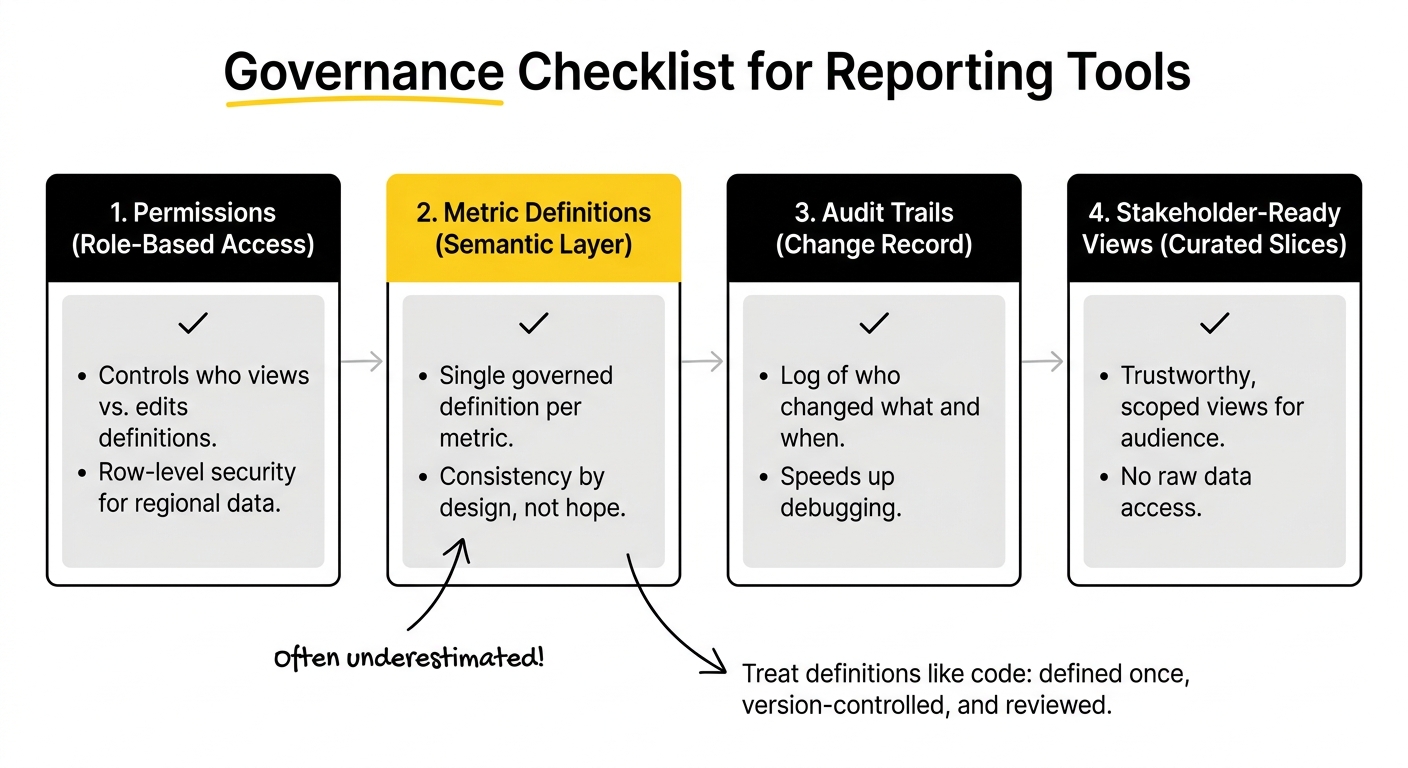
Permissions management in reporting tools and metric definitions for SaaS reporting are the two that large teams underestimate most. Permissions feel like an IT afterthought until the wrong person overwrites a shared definition. And without a central metric layer, every new dashboard is a fresh opportunity for "qualified lead" to mean something slightly different. The tools that handle these well treat metric definitions like code: defined once, version-controlled, and changed only through a review process, which is also what produces the audit trail.
Stakeholder-ready reporting is the capability that turns governance from a defensive measure into something the wider business feels. When a VP opens a view that is already scoped to what they need and built on governed definitions, they get a number they can act on without a meeting to verify it.
The reporting tool landscape for large teams
The market splits into a few categories, and matching the category to your situation matters more than ranking individual products. Business intelligence platforms handle the data visualization and exploration layer. A semantic or metric layer governs definitions underneath them. Data harmonisation tools sit upstream, cleaning and unifying marketing data before it reaches the BI layer. And the CRM and data warehouse hold the source-of-truth records everything reconciles against.
Among the major business intelligence platforms, the differences are really about operating model rather than features:
- Power BI suits Microsoft-centric organisations. It offers mature permissions, row-level security, and deployment pipelines at a low cost per seat as you scale.
- Tableau suits analyst-driven, visualisation-first teams. It has the strongest data visualisation of the three, though systematic metric governance is weaker without add-ons.
- Looker suits warehouse-centric, governance-first teams. It treats governance as code, with metric definitions version-controlled and audit trails built in.
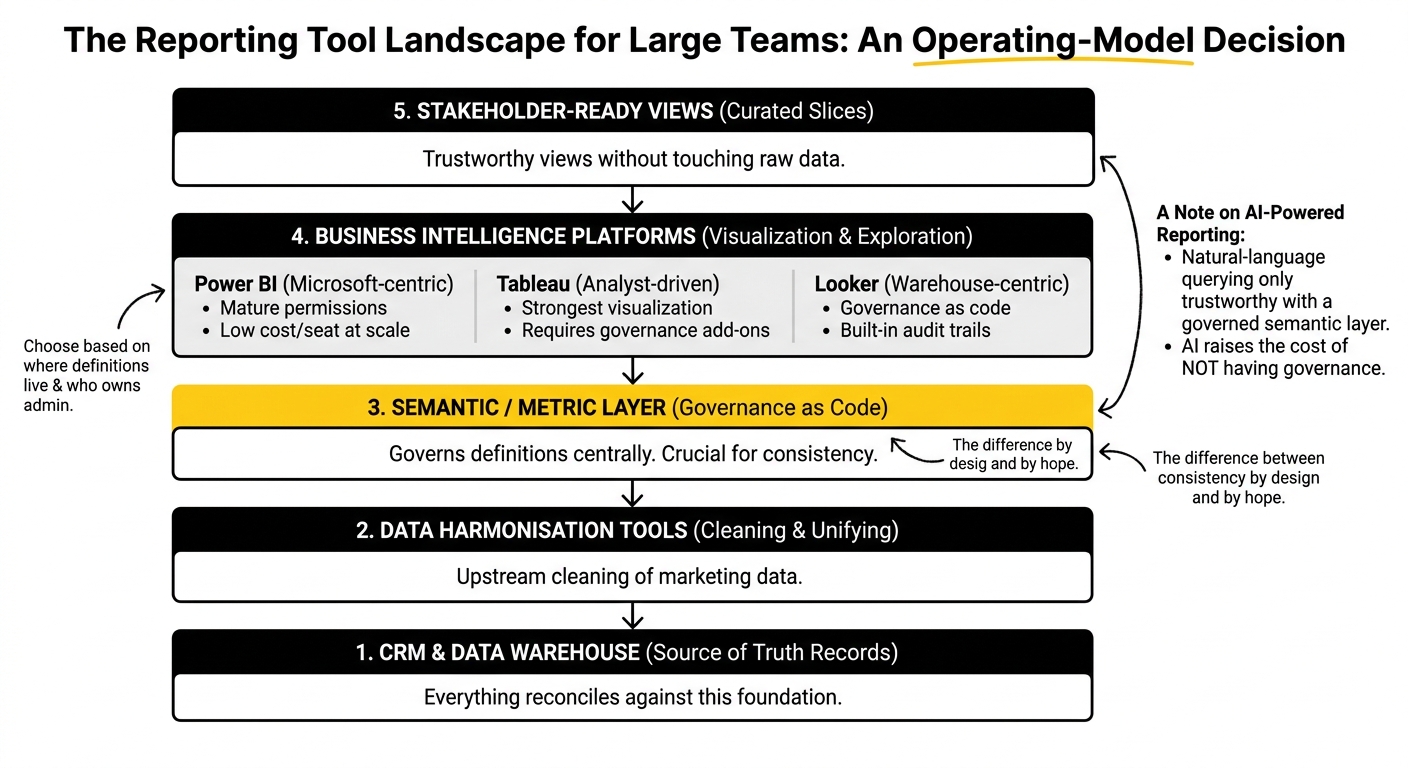
The right answer depends on two questions: where do your metric definitions live, and who owns administration. A Microsoft-heavy org standardises on Power BI almost by gravity. A team with a central data function that wants one governed definition of every metric leans towards a code-based semantic layer. A team where analyst-designers drive everything through dashboards will get more from Tableau's visualisation depth, provided they add the governance it does not enforce on its own.
A note on AI-powered reporting solutions, since every vendor now markets them. Natural-language querying is only as trustworthy as the governed metric layer beneath it. Ask an AI to query an ungoverned warehouse and it will return plausible, confident, and sometimes wrong answers, because it has no business context for what your terms mean. Built on a governed semantic layer, the same feature becomes genuinely useful. The AI does not replace governance; it raises the cost of not having it.
This is why choosing among the best analytics tools for large teams is an operating-model decision, not a feature comparison. The strongest report writing software in the world produces inconsistent numbers if the definitions underneath it are ungoverned.
Integrating reporting tools with your MarTech stack
Most reporting pain in large SaaS teams traces back to siloed data and the manual consolidation it forces. Integrating reporting tools with MarTech means building one governed pipeline from the ad platforms and marketing systems, through a harmonisation layer that standardises naming and metrics, into the warehouse and BI layer, all reconciled against the CRM as the source of truth.
The harmonisation step is what large teams skip and later regret. Pulling raw data from a dozen platforms into a BI tool without normalising it first just moves the inconsistency downstream into prettier charts. A middleware layer that enforces consistent naming, deduplicates entities, and validates inputs before the data lands is what lets the BI layer stop fighting its own inputs.
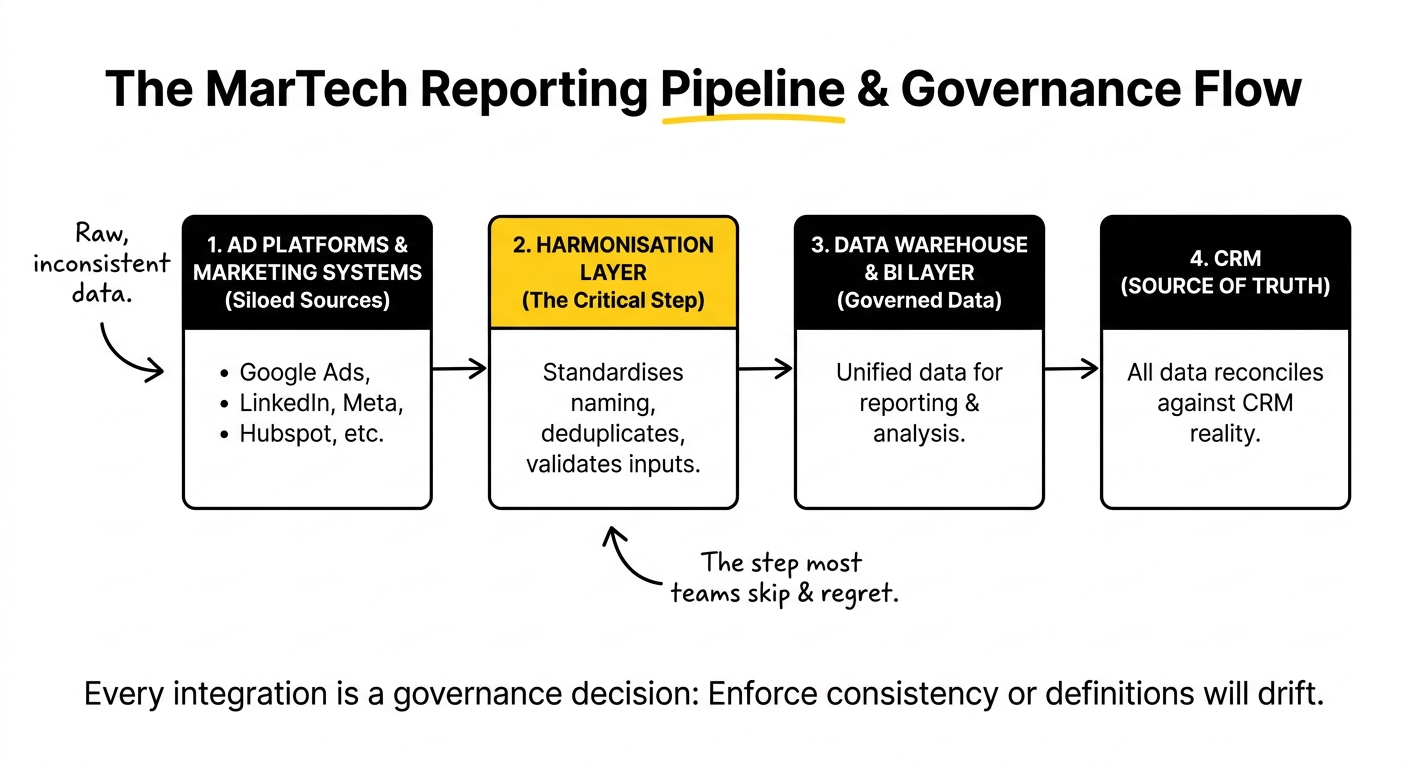
The automation mechanics of building those reports, and how to keep the human commentary and quality checks visible in an automated dashboard, are a topic in their own right, which we cover in our piece on automated SaaS PPC dashboards that still show the work. For governance at scale, the point is narrower: every integration is also a governance decision, because each connection is a chance for a definition to drift unless the pipeline enforces consistency.
A practical framework for evaluating reporting tools
Here is a sequence for choosing without being seduced by a demo.
- Map who needs to see what. Document your permission requirements and who should be able to edit definitions versus only view them, before you shortlist anything.
- Inventory your metric definitions. List the metrics that must mean one thing across the org, and decide where that single definition will live.
- Require audit trails. Treat version control and change history for definitions as non-negotiable, not a nice-to-have.
- Match the tool to your operating model. Consider your cloud, who builds reports, and who governs definitions, rather than ranking visualisation features.
- Check MarTech and CRM integration. Confirm the tool fits your pipeline and assess whether you need a harmonisation layer upstream.
- Pilot with a real report. Measure delivery speed and how cleanly numbers reconcile, not how good the sales demo looked.
- Assign governance ownership before rollout. Decide who owns definitions and approves changes. A tool cannot enforce governance nobody owns.
The discipline underneath all seven steps is to choose the operating model first and the tool second. The reliability large SaaS teams want from reporting does not come from a vendor. It comes from governance the vendor's tool is capable of enforcing, run by people who own it.
If you are working through this, a reporting setup that no longer holds together as the team grows, this is the kind of evaluation we run with SaaS Marketing Ops teams regularly. Worth a conversation if you are at that point. For the upstream side of this, getting clean marketing automation data into these tools in the first place, we go further in our piece on marketing automation data for better SaaS paid media decisions.
Frequently Asked Questions
What are the key features to look for in reporting tools for large SaaS teams?
Prioritise governance over visualisation. The four features that matter most at scale are permissions and role-based access, a central layer for governed metric definitions, audit trails for definition changes, and stakeholder-ready views. Integration with your CRM and wider MarTech stack matters too, since a tool that cannot reconcile to your source of truth will report on the wrong numbers regardless of how good its charts are.
How do reporting tools ensure data governance and integrity?
They enforce governance through a few mechanisms: role-based permissions that control who can change definitions, a semantic or metric layer that defines each metric once so every report calculates it identically, and audit trails that record what changed and when. Together these prevent metric drift, the situation where the same metric is calculated differently in different dashboards with nothing flagging the inconsistency.
What role do permissions play in reporting tools for SaaS organisations?
Permissions control both access and authority. Beyond deciding who can see which data, including row-level security so teams see only their own slice, permissions govern who can edit a shared metric definition versus only consume it. At scale this is critical: without it, the wrong person can overwrite a definition every other report depends on, and the change propagates silently across the organisation.
How can reporting tools integrate with existing MarTech stacks?
Through a governed pipeline. Data flows from ad platforms and marketing systems, usually through a harmonisation or connector layer that standardises naming and metrics, into a warehouse and BI tool, all reconciled against the CRM. The harmonisation step is the one large teams underrate; normalising data before it reaches the BI layer is what stops platform inconsistencies from becoming inconsistent dashboards.
What are the benefits of using automated reporting tools in a SaaS environment?
Automation removes the hours of manual consolidation that large teams lose to copying numbers between platforms, and it applies the same logic every time, reducing human error. The caveat is that automation scales whatever governance you have. Automating ungoverned reporting just produces wrong numbers faster, which is why the governance layer has to come first.
How can stakeholders benefit from stakeholder-ready views in reporting tools?
Stakeholder-ready views give each audience a curated, role-appropriate slice built on governed definitions, so a VP or board member sees a trustworthy number scoped to what they need without touching raw data. The benefit is speed and trust: decisions get made directly from the view rather than after a meeting to verify whose numbers are right.
What metrics should be defined for effective reporting in large SaaS teams?
Define the metrics that must mean one thing across the whole organisation first: pipeline, qualified lead, marketing-sourced and marketing-influenced revenue, customer acquisition cost, and conversion rates between funnel stages. The specific list matters less than the discipline of giving each a single governed definition, owned by someone, so the same term cannot quietly mean different things to different teams.
How do audit trails enhance data governance in reporting tools?
Audit trails record who changed which definition or report and when. When a number moves unexpectedly, they turn a multi-day investigation into a quick lookup, showing exactly what changed and who changed it. They also create accountability, since definition changes go on the record, and they are often a requirement for any regulated or board-level reporting where figures must be defensible.
What challenges do Marketing Operations Specialists face when selecting reporting tools?
The common challenges are siloed data across many platforms, the manual consolidation it forces, and keeping definitions aligned as more people build reports. There is also the difficulty of maintaining governance and documentation for multi-touch attribution. Implementation complexity and the risk of disrupting existing workflows make the choice feel high-stakes, which is why an operating-model-first evaluation beats a feature comparison.
What are the best practices for ensuring reporting reliability in large SaaS teams?
Define metrics centrally and govern changes through a review process with audit trails. Set clear permissions so only the right people edit definitions. Reconcile everything to the CRM as the source of truth, and harmonise marketing data before it reaches the BI layer. Above all, assign ownership of governance to specific people, because reliability comes from owned discipline, not from the tool itself.