Understanding Credible ROI Proof for SaaS PPC Management
What does credible ROI proof actually look like for SaaS PPC? Spend bands, sales cycle context, attribution caveats, and before/after evidence explained.

Your PPC campaigns are generating leads. Your platform metrics look reasonable. And then the CFO asks a simple question in the quarterly review: can you show us the return on what we’re spending?
That question is harder to answer than it should be. Not because the return isn’t there, but because most of what gets presented as ROI proof in SaaS PPC management doesn’t actually answer it. Click-through rates, cost-per-lead averages, and even ROAS figures from the ad platform tell you what happened inside the campaign. They don’t tell you whether the spend produced revenue your business can plan around.
This article is about what credible ROI proof actually requires, for VPs of Marketing at Series B+ SaaS companies who need to defend budget decisions with evidence that holds up when the board gets involved.
Why Most PPC “Proof” Falls Apart Under Scrutiny
The gap between what agencies report and what finance teams want to see is not usually a problem of data availability. It is a problem of framing.
A dashboard showing 200 MQLs at £155 each looks like proof until someone asks what percentage became sales-qualified, how many entered pipeline, and how long those deals took to close. At that point, the evidence base collapses. The leads were real. The spend was real. The connection between the two and closed-won revenue was never properly documented.
This matters more than ever in 2026. According to HubSpot’s State of Marketing Report, CFO scrutiny of marketing budgets has risen sharply, with 63% of CMOs now reporting increased pressure from their finance teams. That pressure is not going away. And presenting platform metrics in response to revenue-focused questions is one of the fastest ways to lose budget credibility.
Credible ROI proof for SaaS PPC management services with demonstrated ROI has six components. Each one matters. Missing any of them leaves a hole that a CFO or board member will find.
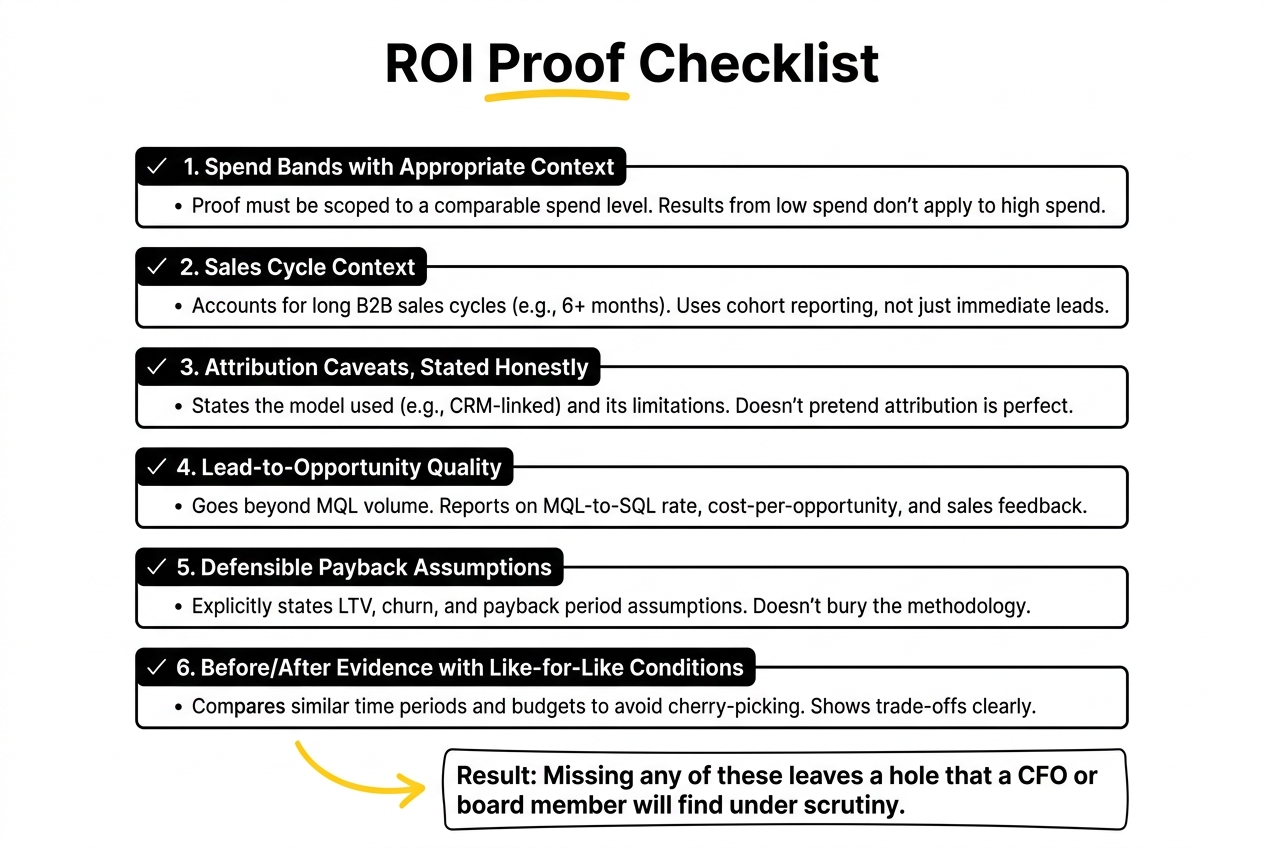
Component 1: Spend Bands with Appropriate Context
The first question any sensible buyer of PPC management services should ask is: what does this proof apply to?
A case study demonstrating strong returns on £10,000 per month in ad spend tells you almost nothing about what to expect at £80,000 per month. The economics change. Keyword pools saturate. Audience sizes hit ceilings. The cost-per-click for competitive SaaS terms has risen 15 to 18% year-on-year in 2026, according to WebFX benchmark data, which means results achieved at lower spend bands two years ago are not straightforwardly replicable today.
When evaluating leading SaaS PPC management services showing proven ROI, look for proof that is explicitly scoped to a spend band comparable to yours. Agencies that present headline results without spend context are either working from a single outlier or assuming you will not ask. Both are red flags.
The spend band question also connects to capacity. At higher budgets, the limiting factor is rarely the ad auction. It is the quality of the creative pipeline, the velocity of landing page testing, and how tightly the targeting is managed. Proof from comparable spend bands tells you whether the agency has actually operated at that level, not just whether their best-ever campaign performed well.
Component 2: Sales Cycle Context
B2B SaaS deals do not close in 30 days. For mid-market and enterprise SaaS companies, average sales cycles regularly run to six months or more, with the B2B buyer journey averaging 211 days from first touch to purchase across complex deals.
This creates a fundamental problem with how ROI gets measured and reported. A PPC campaign that generated strong MQL volume in Q1 may not show its full pipeline contribution until Q3. Any attribution or reporting framework that stops at the lead stage is measuring the wrong thing, and any proof of ROI that does not account for this lag is incomplete.
What credible sales cycle context looks like in practice:
- Cohort-based reporting that tracks leads from the same campaign through the full funnel over time
- Pipeline data that shows when MQLs became SQLs, and when SQLs became opportunities
- A clear statement of the measurement window: “we are reporting on the cohort of leads generated between January and March, and here is their current pipeline status”
- Acknowledgment of any seasonality or external factors that affected conversion velocity during the period
Without this framing, an agency presenting ROI proof is comparing spend from one time period to revenue from a different one. That is not ROI. It is coincidence arranged to look like causation.
Component 3: Attribution Caveats, Stated Honestly
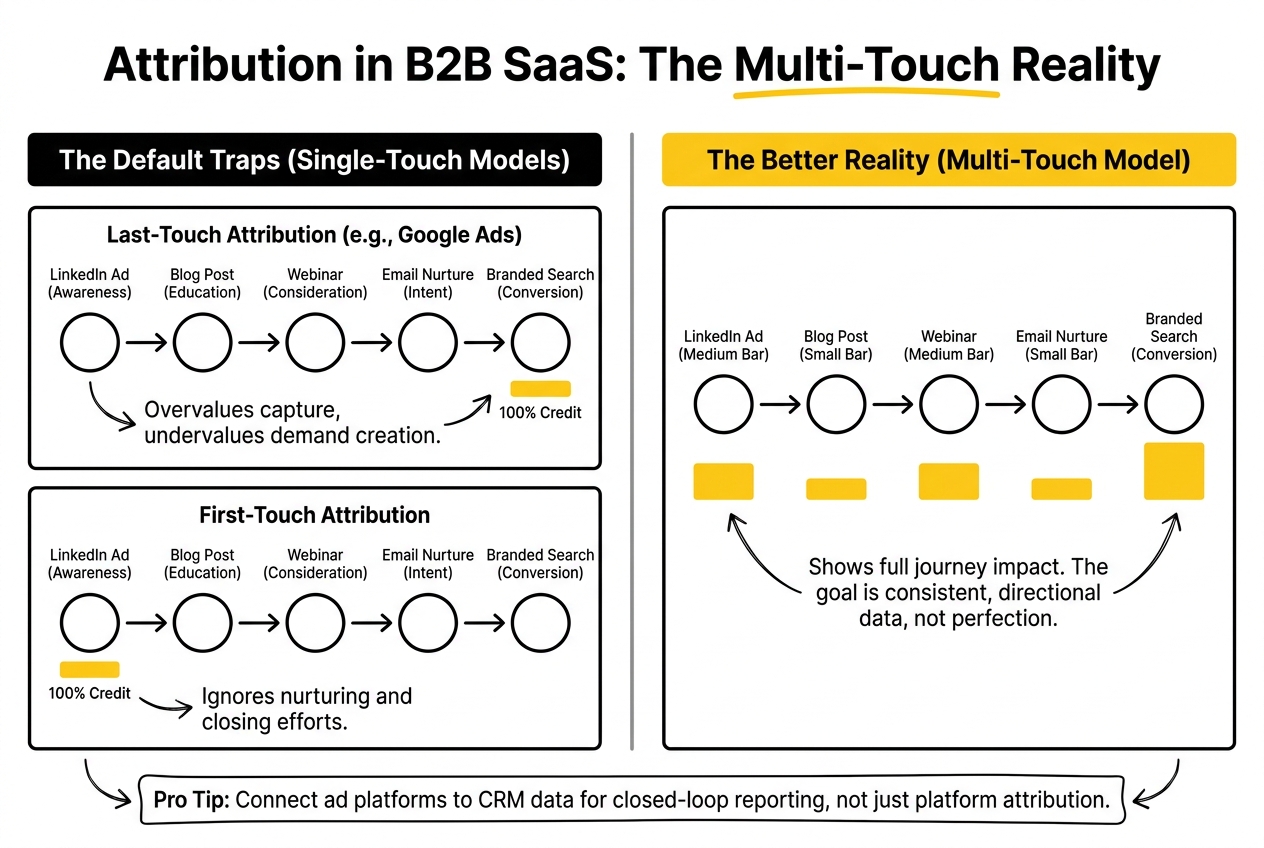
Attribution in SaaS PPC campaigns will never be clean. Deals that close after a six-month sales cycle typically involve multiple touchpoints across search, social, email, and direct outreach. Assigning full credit to a single paid search click is analytically indefensible, even when that click was the first recorded interaction.
Credible ROI proof does not pretend otherwise. It states the attribution model being used, explains what it measures and what it misses, and gives you enough context to judge whether the numbers are directionally reliable.
The most useful attribution approaches for SaaS PPC link to revenue outcomes via CRM data. If a prospect clicked a Google Ad, that click ID (GCLID) gets captured in Salesforce or HubSpot, and then downstream pipeline and revenue events are imported back into the ad platform as offline conversions. This gives you a closed-loop signal that connects spend to pipeline without relying solely on last-click or platform-reported conversions.
What to watch for: agencies that present only platform-attributed revenue without any CRM cross-reference are showing you what Google thinks it generated. That number is almost always higher than what your pipeline data will confirm. The gap between platform attribution and CRM-attributed pipeline is worth asking about directly.
Refine Labs has documented extensively how first-touch and last-touch models both distort the picture in B2B. The goal is not perfect attribution. It is consistent, directional data that points the right way over time.
Component 4: Lead-to-Opportunity Quality
MQL volume is the metric that looks impressive in decks and means the least in isolation.
What matters is the rate at which MQLs from PPC become sales-qualified leads, enter pipeline, and generate opportunities that sales teams actually pursue. The industry benchmark for paid MQL-to-SQL conversion in B2B SaaS sits at around 30%, compared to 51% for non-paid sources, according to TripleDart’s 2025 to 2026 benchmark data from $250M in managed ad spend. That gap is not a reason to avoid paid search. It is a reason to be precise about what “good” looks like within your specific targeting and offer mix.
When evaluating ROI proof for SaaS PPC management, ask for this breakdown:
- MQL-to-SQL conversion rate, broken out for PPC versus other channels
- Cost-per-opportunity (not just cost-per-lead)
- Average deal size and win rate for PPC-sourced pipeline, compared to the blended baseline
- Feedback from the sales team on the quality and intent of leads from paid search
If the proof you are reviewing only goes as far as CPL, push further. A £155 cost-per-lead looks very different depending on whether 10% or 40% of those leads become opportunities. The difference between those two scenarios, at scale, is the difference between a PPC programme that works and one that fills a CRM with contacts sales will not call.
Component 5: Defensible Payback Assumptions
Any ROI claim that does not state its payback assumptions is doing arithmetic without showing its working.
The average CAC payback period for private SaaS companies stands at 23 months, per recent SaaS Capital benchmark data. Enterprise-focused companies with higher ACV can justify longer payback periods because the lifetime value supports it. But those assumptions need to be made explicit, not buried.
When reviewing before and after evidence in PPC from an agency, ask how they calculated the return figure. Specifically:
- What LTV assumption did they use? Was it based on actual historical data for this client, or an industry benchmark?
- What is the assumed churn rate, and is it conservative or optimistic?
- Is the payback period calculated on ad spend only, or on total programme cost including management fees?
- Over what time window is the ROI figure calculated?
A 3:1 LTV:CAC ratio is the standard floor for healthy SaaS unit economics. The median across B2B SaaS in 2025 sat at 3.6:1, according to Benchmarkit. Proof of ROI should show where the programme sits relative to that benchmark, not just claim that returns were positive.
Agencies that present ROI without surfacing these assumptions are either working from undisclosed inputs, or have not thought through the methodology carefully enough to defend it. Either way, the number will not hold up when your CFO asks where it came from.
Component 6: Before/After Evidence with Like-for-Like Conditions
Before and after comparisons are the most persuasive form of ROI proof, and the easiest to manipulate.
The manipulation usually happens through cherry-picking the comparison period. If a new PPC management service took over in October and the before period was the summer (historically lower intent volume for many SaaS categories), the comparison will look flattering regardless of what the new team did. The same logic applies in reverse: if the before period included a high-spend experiment that performed badly, almost anything looks like an improvement by comparison.
Credible before/after evidence specifies:
- The same time period year-on-year (to account for seasonality)
- Whether budget levels were comparable across both periods
- What changed structurally: account architecture, bidding strategy, landing page design, offer type
- Which metrics improved and which ones did not
Proof that only shows what got better is incomplete. A good SaaS PPC management service should be able to show you the trade-offs clearly. Sometimes CPL goes up when you improve targeting quality. Sometimes ROAS drops at higher spend bands. If a case study presents only upward-sloping lines, ask what the graph is not showing.
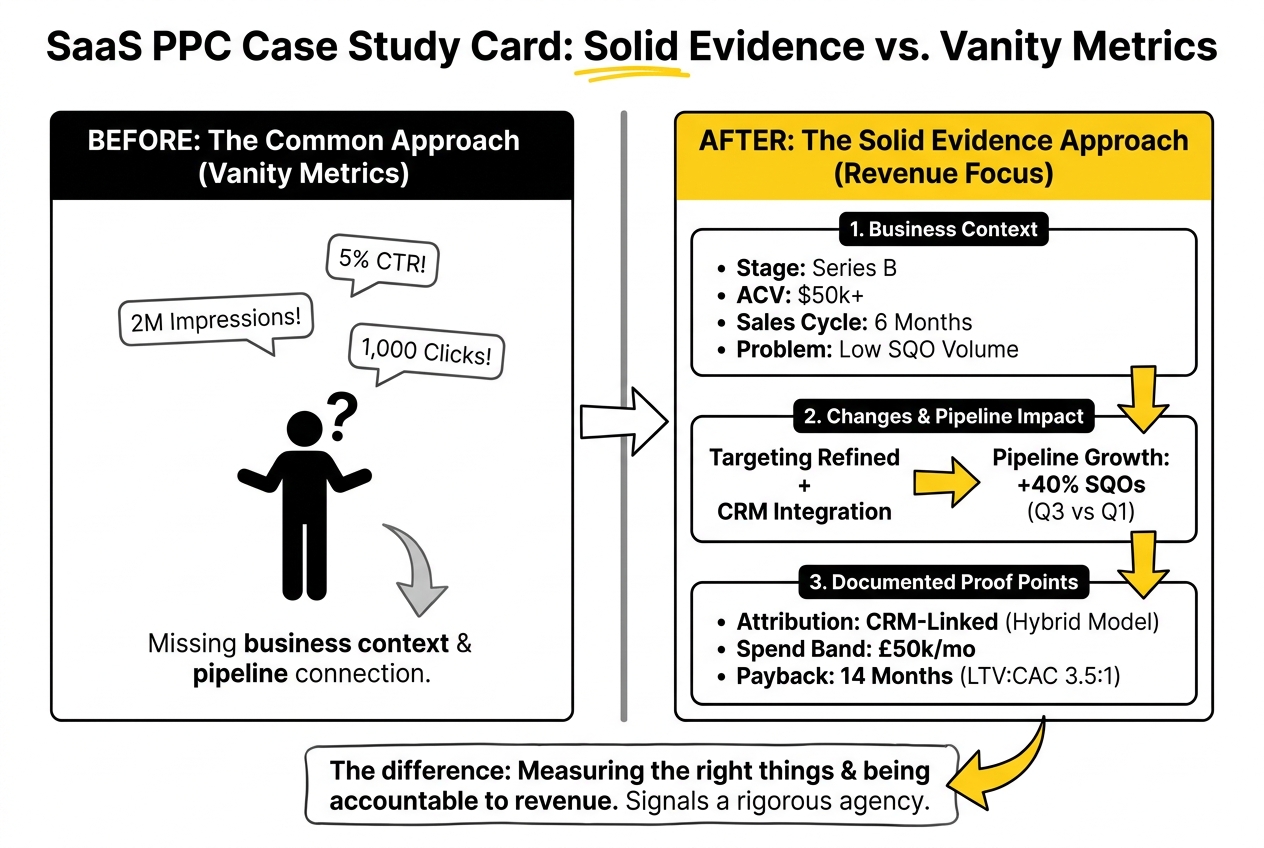
What This Looks Like When the Evidence Is Solid
The best proof packs do not lead with impressions or click-through rates. They open with the business context: company stage, ACV range, sales cycle length, and the specific problem the PPC programme was trying to solve.
They then show the before state, the changes made and why, and the after state measured at pipeline and revenue level. Attribution is explained honestly, including what it cannot capture. Spend bands are stated. Payback assumptions are documented. And the MQL-to-opportunity journey is traced.
That kind of proof is not common. Most agencies do not produce it because it requires ongoing CRM access, close alignment with the client’s finance and sales teams, and a willingness to show results that are nuanced rather than simply positive.
When you find a SaaS PPC management service that produces this level of evidence, it is worth paying attention to. It signals an organisation that is measuring the right things and willing to be accountable to them.
If you are working through how to build or evaluate this kind of evidence base, our top SaaS PPC management services with proven ROI page is a good starting point for understanding what a rigorous SaaS PPC programme looks like in practice.
For companies where ACV and deal complexity push the ROI conversation into enterprise territory, the proof requirements shift further. High-ACV SaaS PPC Agency: How Paid Search Changes for Enterprise Deal Sizes (coming soon)
And if you want to understand what a well-structured SaaS PPC programme should contractually include before you start measuring its ROI, see Service Blueprint: What ‘SaaS PPC & Paid Search Management UK’ Should Actually Include (coming soon)
If you are preparing a board pack or CFO review and the current evidence base does not hold up against the questions above, we run this kind of audit with SaaS teams regularly. Worth a conversation if you are at that point.
Frequently Asked Questions
How do you measure the success and ROI of a PPC campaign?
ROI in SaaS PPC is best measured by connecting ad spend to pipeline and closed-won revenue through CRM data. Capture the Google Click ID at form submission, track the lead through each pipeline stage in your CRM, and import conversion events back into your ad platform. Pair this with cohort reporting so you are measuring leads from the same campaign period against their full downstream revenue contribution, not against revenue that closed in the same month they were generated.
What are the essential elements that constitute credible ROI proof for SaaS PPC management services?
Credible proof requires six things: spend context matched to your budget band, sales cycle framing that accounts for conversion lag, a stated attribution model with its limitations acknowledged, lead-to-opportunity quality data (not just MQL volume), clearly documented payback assumptions including LTV and churn inputs, and before/after comparisons using like-for-like conditions. Proof that omits any of these components will not withstand scrutiny from a CFO or board.
What is the average PPC ROI for SaaS companies?
There is no single average that applies across SaaS, because ROI depends heavily on ACV, sales cycle length, churn rate, and spend level. Top-performing B2B SaaS PPC campaigns reach 4 to 6x ROAS, while the current average across B2B SaaS sits around 2.6x, per SaasHero’s 2026 benchmark data. These figures mean little without LTV context. A 2.6x ROAS on a programme with 90% gross margins and low churn can be highly profitable. The same multiple on a high-churn product with long payback periods may not be.
How can VPs of Marketing effectively demonstrate the effectiveness of their PPC strategies?
Connect PPC reporting to pipeline and revenue metrics, not platform metrics. Present data in cohorts tied to campaign periods rather than calendar months. Show the MQL-to-opportunity conversion rate for paid search versus other channels. Document the attribution model you are using and acknowledge what it does not capture. Frame payback against your actual LTV and churn figures, not industry benchmarks. And where results are mixed, show the trade-offs clearly rather than filtering for positive trends only.
What role do spend bands play in evaluating PPC ROI?
Spend bands determine whether proof from another programme is relevant to yours. Economics at £15,000 per month look different from those at £80,000 per month: keyword saturation, audience reach, and cost-per-click dynamics all shift at higher budgets. When reviewing case studies or agency proof, always check that the spend level referenced is comparable to what you are planning to invest. Results achieved at a materially different spend band have limited predictive value for your programme.
How does sales cycle context impact PPC ROI assessments?
B2B SaaS sales cycles commonly run to six months or more. An ROI assessment that measures leads generated in January against revenue closed in January is comparing spend and return from different time periods. Credible sales cycle context requires cohort-based reporting: track the same group of leads over time, from MQL through SQL to pipeline to closed-won. Without this, reported ROI figures reflect coincidence as much as causation.
What are common attribution caveats to consider in SaaS PPC campaigns?
Multi-touch attribution across long sales cycles is inherently imprecise. The main caveats are: platform-reported revenue is almost always higher than CRM-attributed pipeline; first-touch and last-touch models both distort the picture in B2B because neither accounts for the full buying committee journey; and any attribution model will undercount dark social and offline influences. State the model you are using, note its limitations, and focus on directional consistency over time rather than precise attribution of every pound of revenue.
How can lead-to-opportunity quality affect the perceived ROI of PPC efforts?
High MQL volume at low CPL can look like strong ROI until you apply funnel conversion rates. If paid MQLs convert to SQLs at 15% while organic MQLs convert at 45%, the true cost-per-opportunity from PPC may be three times higher than the CPL figure suggests. Lead quality affects every downstream metric: sales cycle length, win rate, and average deal size. Measuring ROI at the top of the funnel only inflates apparent performance. Track cost-per-opportunity and PPC-sourced win rate alongside CPL to get an accurate picture.
What payback assumptions should be made when evaluating PPC ROI?
Use your actual LTV and churn figures rather than industry benchmarks. State the time window over which ROI is being calculated. Account for the full cost of the programme, including management fees and internal resource, not just media spend. And apply a payback period that reflects your real sales cycle: a 12-month payback calculation is not meaningful if your average deal closes in nine months and then churns in 18. Model at least two scenarios, one conservative and one based on current retention performance, to give the ROI figure a range rather than a single point estimate.
How can before/after evidence comparisons strengthen the case for PPC budget decisions?
Before/after evidence is most persuasive when it controls for variables: same time of year, comparable spend levels, and clearly documented changes in strategy or execution. It should cover both what improved and what did not, with an explanation of any trade-offs. Pipeline and revenue metrics carry more weight than platform metrics in this context. If before/after data shows that cost-per-opportunity fell 30% after restructuring the account, and that improvement is tied to specific cohorts tracked through to closed-won revenue, that is the kind of evidence that holds up in a budget review.