Mastering CAC, LTV, and Payback Period in B2B SaaS Marketing
Master CAC, LTV, and payback period to optimise your PPC budget allocation. Learn to segment by channel and ICP, understand investor expectations, and make data-driven decisions that drive sustainable growth.

Your CFO is asking why you spent $500,000 on paid search last quarter. The board wants to see ROI. Your sales leader is questioning whether leads from PPC are actually worth the cost. And you're sitting in a meeting trying to explain why acquisition costs are rising while customer lifetime value feels unclear.
This is the reality for most Revenue-Accountable VPs of Marketing at Series B+ SaaS companies. You're caught between aggressive growth targets and capital efficiency expectations. You need to prove that every dollar spent on PPC drives predictable, profitable revenue. But you can't do that without understanding three metrics: Customer Acquisition Cost (CAC), Lifetime Value (LTV), and Payback Period.
These aren't vanity metrics. They're the foundation of every scaling decision you'll make. They tell you whether your PPC strategy is sustainable. They show investors you understand your unit economics. They guide budget allocation across channels. And they're the data your board actually wants to see.
The problem is that most teams calculate these metrics wrong, segment them inconsistently, and fail to use them to make real decisions. This article fixes that. You'll learn how to calculate CAC, LTV, and payback period accurately, segment them by channel and Ideal Customer Profile, and use them to optimise your PPC strategy for sustainable growth.
Understanding Customer Acquisition Cost (CAC)
Customer Acquisition Cost is simple in concept, devilish in execution.
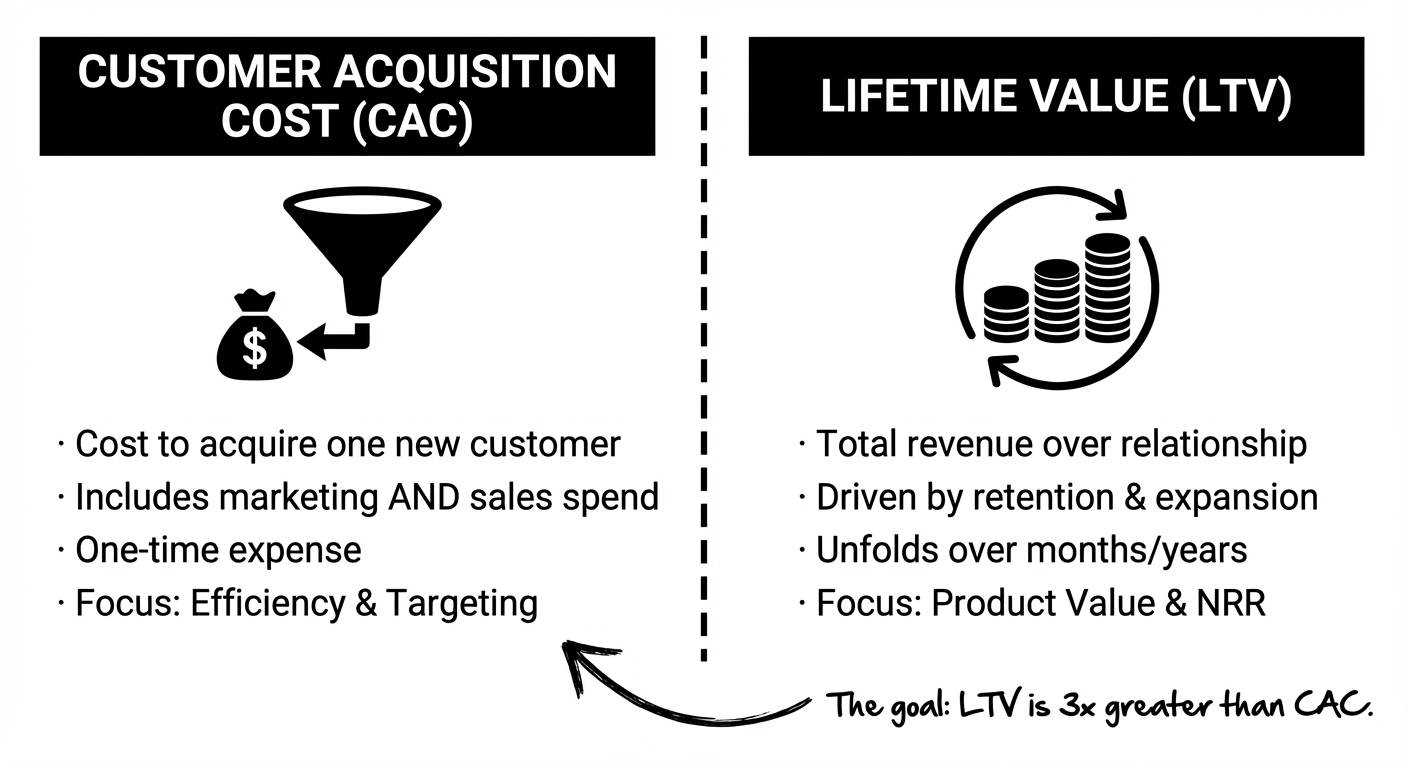
At its core, CAC measures how much you spend in sales and marketing to acquire one new customer. The formula is straightforward: divide your total sales and marketing spend by the number of new customers acquired in a given period.
CAC equals total sales and marketing spend divided by the number of new customers acquired. If you spent $100,000 on marketing and sales in a month and acquired 50 customers, your CAC is $2,000.
But here's where teams go wrong. Most don't include all relevant costs in their CAC calculation. They count ad spend, but forget about sales salaries. They count paid advertising, but exclude content marketing and sales operations overhead. They end up with artificially low CAC numbers that misrepresent their true acquisition efficiency.
A proper CAC includes:
This matters because it changes your understanding of whether a channel is actually profitable. A channel that looks cheap at $500 CAC (ad spend only) might actually cost $2,000 when you include all the sales infrastructure required to close deals.
CAC also varies dramatically by segment. Early-stage SaaS companies in 2026 see CAC between $200 and $400. Mid-stage companies (Series B-C) run $300 to $600 CAC. Enterprise-focused businesses often exceed $1,000 CAC because they require longer sales cycles, more touchpoints, and dedicated account executives. FinTech sits at the high end, around $1,450 CAC, due to regulatory complexity and security requirements.
The key insight: CAC is not a single number. It's a range that depends on company stage, customer segment, and sales model. You need to calculate it separately for each segment you serve.
Understanding Lifetime Value (LTV)
Lifetime Value is where most teams lose clarity.
LTV measures the total revenue a customer is expected to generate over their entire relationship with your company. Unlike CAC, which is a one-time expense, LTV unfolds over months or years. It's the second half of the unit economics equation.
The basic LTV formula is: LTV equals ARPA (Average Revenue Per Account) multiplied by Gross Margin, divided by monthly churn rate.
LTV = (ARPA × Gross Margin) / Monthly Churn Rate
This formula highlights an important truth: LTV is incredibly sensitive to churn. Reduce your monthly churn from 3% to 2%, and your LTV increases by 50%. Reduce it to 1.5%, and your LTV doubles. This is why retention matters as much as acquisition in SaaS unit economics.
Let's walk through a real example. Imagine a B2B SaaS company with $10,000 ARPA (annual contract value divided by 12), 80% gross margin, and 2% monthly churn.
LTV = ($10,000 × 0.80) / 0.02 = $400,000
That customer is worth $400,000 over their lifetime. If your CAC for that customer was $2,000, your LTV:CAC ratio is 200:1, exceptionally healthy.
But now imagine churn rises to 4% monthly (customers stay about 25 months instead of 50). That same customer now has an LTV of only $200,000. Your LTV:CAC ratio drops to 100:1. Still healthy, but the business is less valuable.
This is why retention is growth. A 1% improvement in monthly churn can have a greater impact on unit economics than a 10% reduction in CAC.
B2B SaaS LTV varies by customer segment. SMB customers (under $15K ACV) have LTV between $15,000 and $40,000. Mid-market customers range from $80,000 to $200,000 LTV. Enterprise customers can exceed $1,000,000 LTV. These are benchmarks from Optifai's analysis of 939 B2B SaaS companies in 2025, segmented by customer size and churn rates.
The critical point: you can't calculate LTV without knowing your churn rate. And you can't improve unit economics without investing in retention.
Calculating Payback Period
Payback period answers a different question than LTV:CAC ratio. Instead of asking "what's the total value of this customer", it asks "how long until I break even on their acquisition".
CAC Payback Period = CAC / (ARPA × Gross Margin)
The result is the number of months it takes for a customer to generate enough revenue to cover their acquisition cost.
Using our earlier example: if CAC is $2,000, ARPA is $10,000, and gross margin is 80%, then payback period is $2,000 / ($10,000 × 0.80) = 2.5 months.
This customer pays for themselves in 2.5 months. Everything they generate after that is profit (before you account for operational costs).
Payback period matters more to boards and investors than LTV:CAC ratio, especially for cash-constrained companies. Why? Because payback shows capital efficiency. A company with a 12-month payback period can reinvest cash more quickly than a company with a 24-month payback. Fast payback period means the business is capital-efficient and can scale without running out of cash.
For B2B SaaS in 2026, benchmarks are:
These benchmarks vary by stage. Early-stage companies targeting under $5M ARR should aim for 8-12 month payback. Series B-C companies should target 12-18 months. Enterprise-focused businesses can support 18-24 month payback because their higher ARPA justifies longer sales cycles.
The median B2B SaaS company in 2026 has a 15-month payback period. But companies that reach sub-12-month payback show capital efficiency that impresses investors and supports confident scaling.
The Relationship Between CAC, LTV, and Payback Period
These three metrics work together, but they measure different things.
CAC tells you how much you're spending. LTV tells you what you're getting. Payback period tells you how fast. The LTV:CAC ratio tells you if the relationship is healthy. The payback period tells you if it's sustainable.
A healthy LTV:CAC ratio is 3:1 minimum. This means each customer is worth three times what it cost to acquire them. Most B2B SaaS companies target 3:1 to 5:1. Ratios below 3:1 signal that acquisition costs are too high relative to customer value. Ratios above 5:1 indicate strong unit economics and room to invest more in growth.
But here's the catch: a healthy LTV:CAC ratio doesn't guarantee cash flow. A company with a 5:1 ratio but a 24-month payback period will run out of cash before they see the benefit. Conversely, a company with a 3:1 ratio but a 10-month payback can scale more aggressively.
This is why Series B+ companies care most about payback period. It's the fastest indicator of whether their growth is sustainable.
The relationship also reveals common mistakes. A rising payback period (month-over-month or quarter-over-quarter) indicates efficiency problems. It means CAC is climbing faster than ARPA is growing. This often happens during aggressive scaling when you've exhausted core audiences and moved to secondary channels. It's not necessarily bad, but it requires attention.
A payback period that exceeds customer lifetime is the ultimate red flag. If customers churn before they pay back CAC, your unit economics are broken. You're spending more to acquire customers than they generate in revenue. This is unsustainable at any stage.
Segmenting CAC and LTV by Channel and ICP
This is where most teams fail. They calculate a single CAC and a single LTV across the entire business, then wonder why their marketing strategies aren't working.
The reality: CAC and LTV vary dramatically by channel and by Ideal Customer Profile.
PPC (Google Ads) typically generates CAC of $300-$600 for B2B SaaS, depending on keyword competitiveness and landing page conversion rates. LinkedIn Ads run $400-$800 CAC. Content marketing (organic) produces the lowest CAC over time, $500-$1,500 per customer, but with longer conversion windows. Referrals are the most efficient at $141-$200 per customer, but you can't scale them easily.
The customers acquired from each channel have different characteristics. PPC tends to attract high-intent, near-ready-to-buy prospects. They have short sales cycles and higher close rates. Content marketing tends to attract earlier-stage prospects. They need more nurturing. Referrals tend to be the highest quality, lowest churn, highest LTV customers because they come pre-vetted by existing customers.
This means a single CAC number is misleading. A company might have an overall CAC of $1,000, but break it down by channel and find:
Now the strategy becomes clear. You don't reduce CAC across the board. You invest more in referrals (highest ROI), maintain PPC at current levels, and either improve content marketing conversion or reduce budget there.
Similarly, segment LTV by ICP. A mid-market customer (let's say $50K ACV) has an LTV of $150,000 because they stay longer and expand. A small business customer ($5K ACV) has an LTV of $20,000 because they churn faster. Your payback period is vastly different:
Now you understand why some teams focus on mid-market. The payback is faster. The LTV is higher. The unit economics are more attractive.
The insight: segment everything. CAC by channel and ICP. LTV by customer segment. Payback period by both. When you do this work, the data tells you exactly where to invest.
The LTV:CAC Ratio and Investor Confidence
If you're raising capital or have investors on your board, they care deeply about LTV:CAC ratio.
A 3:1 ratio (minimum healthy) tells investors that for every dollar spent acquiring a customer, you're generating three dollars in lifetime revenue. It's sustainable. A 5:1 ratio tells them you have room to invest more aggressively in growth. A 2:1 ratio signals problems and triggers questions about unit economics.
The median B2B SaaS company has a 3.2:1 LTV:CAC ratio. This is from Optifai's analysis of 939 B2B SaaS companies in 2025. Companies below this median face pressure from investors to improve unit economics. Companies above it have more optionality on how to deploy capital.
But LTV:CAC can mislead you if churn is high. A company with $100,000 LTV and $30,000 CAC has a 3.3:1 ratio that looks healthy. But if churn is 5% monthly, those customers are leaving after 20 months. If churn is 2% monthly, they're staying 50 months. The ratio is the same, but the business is fundamentally different.
This is why payback period is the second question investors ask. LTV:CAC tells them if unit economics are healthy. Payback period tells them if the business can scale without running out of cash.
How ICP Influences CAC and LTV Calculations
Ideal Customer Profile isn't just a marketing concept. It's a unit economics concept.
When you define your ICP precisely, you're defining which customers will have the lowest CAC and highest LTV. A company targeting the wrong ICP might have customers with a 2:1 LTV:CAC ratio. A company targeting the right ICP might have the same acquisition spend but find customers with a 4:1 ratio.
Why? Because the right ICP customers:
The math shifts dramatically. Let's compare two scenarios for a B2B SaaS company.
Scenario 1: Casting a wide net (wrong ICP)
Scenario 2: Targeting perfect ICP (right ICP)
The second scenario is obviously superior. But it only works if you define ICP precisely and target it relentlessly. Broad targeting might acquire more customers initially, but unit economics suffer.
Common Pitfalls in CAC, LTV, and Payback Period Calculations
Most teams make the same mistakes when calculating these metrics.
First mistake: Including all costs except sales salaries. Teams count ad spend and marketing tools but forget that a $150,000 sales salary is a cost of customer acquisition. If one salesperson closes 20 customers per year, that's $7,500 CAC per customer from salary alone. Add commission, benefits, and overhead, and you're at $10,000+ per customer just for the person closing deals. Ignore this and your CAC is dangerously low.
Second mistake: Using revenue instead of profit for LTV. If you collect $10,000 from a customer but only keep $8,000 after COGS, your LTV calculation should use the $8,000 (gross profit). Using gross revenue inflates LTV by 20-25%, leading to false confidence in unit economics.
Third mistake: Averaging CAC across customers with very different sales cycles. An SMB customer acquired through content marketing took 6 months to close. An enterprise customer acquired through an outbound sales rep took 12 months to close. If you average the marketing spend over 18 months instead of calculating each cohort separately, your CAC is meaningless.
Fourth mistake: Ignoring cohort churn rates. A customer acquired in January might have 1% monthly churn. A customer acquired in November might have 4% churn (they're leaving for the holidays, then not coming back). If you use an average churn rate, your LTV estimate for the November cohort is 4x too high.
Fifth mistake: Using payback period instead of cash payback period. Accounting payback period assumes all revenue hits your bank account immediately. Cash payback period accounts for the fact that most B2B SaaS companies have payment terms (Net 30, Net 60). If your customer pays $10,000 per year but pays monthly, you only see $833 in cash per month. Your cash payback period is 3 months longer than your accounting payback period. For a $2,000 CAC with monthly billing of $833, cash payback is 2.4 months. But if they pay Net 30, you don't see cash for 30 days after the invoice, so cash payback is 3.4 months. That month matters when you're managing cash flow. Building a Scale-Ready SaaS PPC Engine After PMF: From Ad-Hoc to Operating System, also on this blog, takes this further.
Sixth mistake: Not accounting for the sales cycle in payback period. Your salesperson closes a deal in January and the customer starts in February. The first revenue doesn't hit until March. If you calculate payback period from the close date, you're missing 1-2 months of customer acquisition spend that happened before the sale. Calculate payback from the revenue start date instead.
The lesson: precision in calculation matters more than optimization of the metrics themselves. Get the inputs right, and the insights follow.
Using These Metrics for PPC Strategy Optimization
CAC, LTV, and payback period should directly inform your PPC strategy.
Start with payback period. Calculate it by channel. Google Ads might have an 8-month payback. LinkedIn might have a 12-month payback. Content marketing might have an 18-month payback. This tells you which channels generate cash fastest and can be reinvested immediately into scaling.
Early-stage companies with limited capital should focus on channels with the shortest payback. A company with $200,000 in annual marketing budget can't afford 18-month payback periods. They'd run out of cash before seeing ROI. They need 6-10 month payback so they can reinvest cash every quarter.
Mid-stage companies can support slightly longer payback because they have more capital. A Series B company with $2M annual marketing budget might accept 12-15 month payback on a strategic channel because they can carry the cash burn.
Next, use LTV:CAC ratio to decide if a channel should be expanded. If Google Ads shows a 3.5:1 ratio and you're currently spending $300,000 per year, you have room to increase spend. A 4:1 ratio supports more aggressive scaling. A 2:1 ratio signals you should reduce spend and reallocate to more efficient channels.
Third, segment by ICP and look for outliers. If your mid-market PPC has a 3-month payback and your SMB PPC has a 15-month payback, you should be spending more on mid-market PPC. The channel is more efficient for that segment.
Fourth, use scenario modeling. "What happens to payback period if we reduce CAC by 10% through improved landing page conversion? What happens if we reduce CAC by 30% through more precise keyword targeting?" Model these scenarios monthly. Incremental improvements compound. A 5% improvement in conversion rate might reduce CAC from $800 to $760, improving payback from 12 months to 11.4 months. Over a year, that's an extra month of compounded cash reinvestment.
The principle: use these metrics not just to measure performance, but to guide allocation decisions. Where should the next $100,000 of marketing budget go? Wherever CAC is lowest and payback is shortest. This forces discipline on capital allocation.
.jpeg)
Scenario Modeling and Runway Impact
Understanding how CAC changes affect your runway is crucial for Series B+ companies.
Scenario modeling answers questions like: "If CAC rises 20% next quarter due to increased competition, how long until we run out of cash? What do we need to do to stay on track?"
Let's say you have 18 months of runway and you're burning $500,000 per month. CAC is currently $2,000 and you're acquiring 100 customers per month at that CAC ($200,000 per month in acquisition spend). If CAC rises to $2,400 (20% increase), you're now spending $240,000 per month on acquisition, an extra $40,000 per month in burn.
Scenario modeling forces this clarity. Create a financial model that ties CAC to runway. When CAC moves, runway changes. When retention improves (churn decreases), runway extends. When ARPA increases, runway extends. When CAC rises, runway shrinks.
Model different scenarios:
This isn't pessimism. It's capital planning. The board wants to see that you understand the sensitivity of your unit economics and have plans for different scenarios.
.jpeg)
Aligning Marketing Metrics with SaaS Magic Number
The SaaS Magic Number is a growth efficiency metric that combines CAC, LTV, and payback period into a single indicator.
Magic Number = (ARR Month N - ARR Month N-3) / Total Sales and Marketing Spend in Quarter N-3
A Magic Number above 0.75 indicates that for every dollar spent on sales and marketing, you're generating more than $0.75 in ARR added. This is good. A Magic Number above 1.0 is best-in-class. A Magic Number below 0.5 indicates your growth engine is inefficient.
Your payback period and LTV:CAC ratio should be aligned with your Magic Number. If your payback is 12 months and your LTV:CAC is 3:1, your Magic Number should be around 0.6-0.75. If your payback is 6 months and your LTV:CAC is 5:1, your Magic Number should be 0.9+.
The insight: these metrics are interconnected. Don't optimize CAC in isolation. Optimize the entire system.
Frequently Asked Questions
What is Customer Acquisition Cost (CAC) and how is it calculated?
CAC measures how much you spend in sales and marketing to acquire one new customer. Calculate it by dividing total sales and marketing spend (including salaries, tools, commissions, and infrastructure) by the number of new customers acquired in a given period. For B2B SaaS in 2026, CAC ranges from $200-$400 for early-stage companies to $1,000+ for enterprise-focused businesses.
What is Lifetime Value (LTV) and why is it important in B2B SaaS?
LTV represents the total revenue a customer is expected to generate over their relationship with your company. It's calculated as (ARPA × Gross Margin) divided by monthly churn rate. LTV is crucial because it tells you whether your unit economics are sustainable. A healthy LTV:CAC ratio (minimum 3:1) shows that you're generating enough customer value to reinvest in growth.
How do you calculate the payback period in a B2B SaaS context?
Payback period is calculated as CAC divided by (ARPA × Gross Margin). The result shows how many months it takes for a customer to generate enough revenue to cover their acquisition cost. For B2B SaaS, a payback period under 12 months is considered strong. Best-in-class companies achieve 6-10 month payback.
What is the relationship between CAC, LTV, and payback period?
CAC tells you what you're spending. LTV tells you what you're getting. Payback period tells you how fast. The LTV:CAC ratio indicates whether unit economics are healthy (minimum 3:1). The payback period indicates whether growth is sustainable (under 12 months for capital efficiency). Together, they show whether your PPC strategy is both profitable and scalable.
How can segmenting CAC and LTV by channel improve marketing strategies?
Segmentation reveals which channels and customer segments are most profitable. You might find that PPC has a 3-month payback for mid-market customers but a 15-month payback for SMB customers. This clarity tells you to allocate more budget to the efficient channel and either improve or reduce spend on the inefficient one. Segmentation also shows which ICPs generate the highest LTV, guiding targeting decisions.
What is considered a healthy LTV to CAC ratio for B2B SaaS companies?
A healthy LTV:CAC ratio is 3:1 minimum. This means each customer is worth at least three times what it cost to acquire them. Most B2B SaaS companies target 3:1 to 5:1. The median B2B SaaS company in 2026 has a 3.2:1 ratio. Ratios below 3:1 signal that acquisition costs are too high relative to customer value and require immediate attention.
How does the payback period affect budgeting and financial planning in SaaS marketing?
Payback period directly affects how much capital you can deploy. A company with a 12-month payback can reinvest cash every 12 months. A company with a 24-month payback must carry the investment twice as long, requiring more capital or lower growth rates. Shorter payback periods enable more aggressive scaling because cash compounds faster. This is why Series B+ companies prioritize sub-12-month payback.
What role does the Ideal Customer Profile (ICP) play in calculating CAC and LTV?
ICP determines which customers have the lowest CAC and highest LTV. Targeting the right ICP customers reduces CAC through more efficient targeting, increases ARPA through better fit, reduces churn through better product match, and shortens sales cycles. A company targeting the wrong ICP might have a 2:1 LTV:CAC ratio. The same company targeting the right ICP might achieve 4:1 with identical acquisition spend.
How can understanding these metrics help in optimizing PPC strategies for SaaS?
Calculate CAC, LTV, and payback period by channel and ICP. Allocate more budget to channels with the shortest payback. Expand channels with healthy LTV:CAC ratios. Reduce or improve channels with ratios below 3:1. Use scenario modeling to understand sensitivity to CAC changes. Segment by ICP to identify which customer types are most profitable. This data-driven approach replaces gut feel with clarity.
What are common pitfalls to avoid when calculating CAC, LTV, and payback period?
The main pitfalls are: including incomplete costs in CAC (forgetting sales salaries), using revenue instead of gross profit in LTV, averaging CAC across different sales cycles, ignoring cohort-specific churn rates, using accounting payback instead of cash payback, and not accounting for sales cycle timing in payback calculations. Precision in inputs matters more than sophistication in analysis.
For a comprehensive framework on presenting these metrics to boards and investors, see Building a SaaS Marketing Scorecard for Board and Investor Updates.