Structuring Board Packs for Series A+ SaaS: Simplifying PPC, CAC, and Payback
Learn to structure board packs that clarify CAC, payback, and PPC efficiency for Series A+ SaaS companies. Empower your marketing insights.

Your board meeting is in two days. Your CFO asked for one slide explaining your PPC efficiency. You sit down to build it and stare at a blank page. How do you explain CAC. What does payback period mean to someone who doesn't live in marketing spreadsheets. How do you make the case that PPC is worth the budget when most board members think marketing is a cost center, not a growth engine.
This is the VP of Marketing's dilemma at Series A+ companies. You're evaluated on revenue. You're responsible for pipeline. Your board expects clear answers about whether your PPC spend delivers value. And you're stuck trying to translate marketing metrics into business language.
A board pack solves this. Not by adding more data. By translating complexity into clarity. By connecting PPC spend to revenue outcomes. By answering the question your board is actually asking: is this working, and should we keep doing it.
This article walks through how to structure a board pack that does exactly that. Not with marketing jargon. With business language your CFO and board understand. Structuring SaaS PPC Accounts for PLG vs Sales-Led Funnels, also on this blog, takes this further.
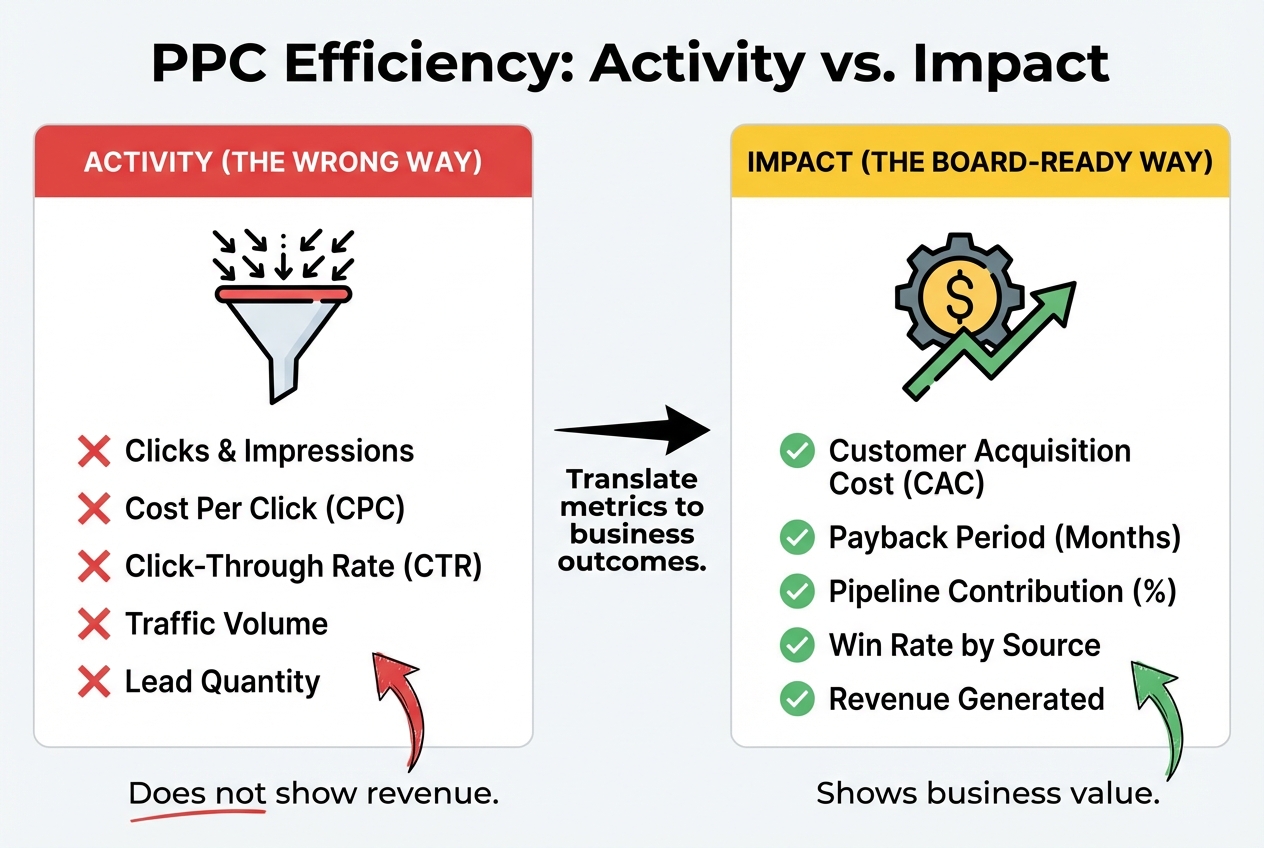
The Problem With Traditional PPC Reporting
Most CMOs report PPC performance using dashboards designed for performance marketers. Click-through rate. Cost per click. Conversion rate. Impressions. These metrics answer: did my campaigns run well. They don't answer: did we generate revenue.
Your board doesn't care about CTR. They care about this: we spent 500k on PPC this quarter. How much revenue did that generate. Is that a good return. Should we spend more or less next quarter.
These are business questions. Most PPC reports don't answer them. They report activity metrics instead. They show volume without showing value.
The fix is to translate PPC metrics into business metrics. CAC instead of CPC. Payback period instead of conversion rate. Pipeline attribution instead of lead volume. This translation is what a board-ready pack does.
The Core Metrics: CAC, Payback, and Pipeline Efficiency
Start with Customer Acquisition Cost. CAC is how much you spend to acquire one customer. Calculate it simply: total PPC spend divided by new customers acquired from PPC. If you spent 100k on PPC and acquired 10 customers, your CAC is 10k.
But CAC alone is incomplete. You need context. Is 10k good or bad. It depends on your business model. Your ACV. Your gross margin. Your expected customer lifetime.
That's where payback period comes in. Payback is how long it takes for a customer to generate enough revenue to cover their acquisition cost. If your CAC is 10k and your gross profit per customer is 2.5k per month, payback is four months. That's healthy. It means you recover the acquisition cost in four months, leaving years two and three for pure profit.
Finally, pipeline efficiency. Not all PPC is created equal. Some campaigns deliver high-quality pipeline. Some deliver volume. Your board needs to know the difference. Pipeline efficiency answers: what percentage of your total pipeline came from PPC. Is it growing or shrinking. Is it delivering customers that close.
These three metrics, together, tell the story your board wants to hear. How much you're spending. How long it takes to recover that spend. How valuable the resulting pipeline is. Everything else is supporting detail.
Building Your Board Pack: The Five-Part Structure
A board-ready PPC pack has five parts. Each part answers a specific question your board is thinking.
Part One: The Headline. Spend 500k on PPC. Generated 250 customers. Payback period is five months. One clear sentence that answers: is PPC working. If the answer is yes, the rest of the board pack is context. If it's no, everything else is your mitigation plan.
Part Two: CAC by Channel. You probably run multiple PPC channels. Google Ads. LinkedIn. Retargeting. Each has different unit economics. Show CAC for each. This tells your board which channels are efficient and which are expensive. Don't hide the expensive ones. Explain why they're worth keeping. Or make the case to shut them down.
Part Three: Payback Deep Dive. Show your CFO how you calculated payback. CAC times 10k. Monthly gross margin per customer times 2.5k. Payback period of four months. Show the formula. Show the math. This builds credibility. Your CFO respects someone who can do the math.
Part Four: Attribution and Risk. Your board knows attribution is messy. Don't hide it. Explain your attribution model. Show where it understates and overstates PPC contribution. Adjust your numbers accordingly. This honesty builds trust more than claiming perfect attribution.
Part Five: Future Outlook. Your board cares about next quarter. Based on current payback and CAC, what's your plan. Are you scaling PPC spend. Reducing it. Testing new channels. This shows you're thinking forward.
Five parts. Five slides. That's your board pack.
Simplifying CAC for Non-Technical Stakeholders
CAC confuses people who don't work with it daily. It's just a ratio, but it feels abstract. Your job is to make it concrete.
Start with a scenario. We spend 10k to acquire one customer with a 50k annual contract value. That customer stays with us for four years. They generate 200k in lifetime revenue. Our CAC of 10k means we're paying 5 percent of lifetime value to acquire the customer. That's healthy. Show the math. Show the timeline. Now CAC makes sense.
Use comparisons. Our CAC is 10k. Industry benchmark for mid-market SaaS is 8k to 15k. We're in the middle of the range. This context makes your CAC meaningful.
Use visuals. A timeline showing when you recover the 10k CAC. A bar chart comparing your CAC to competitors. A simple formula: spend divided by customers equals CAC. Don't use jargon. Use pictures. Use numbers. Use stories.
.jpeg)
Explaining Payback Period: The Revenue Recovery Timeline
Payback period is when your customer generates enough revenue to cover their acquisition cost. For most boards, this is the most important metric. It determines how fast your business scales. Fast payback means you can reinvest revenue into more acquisition. Slow payback means you need outside capital.
Explain it with a timeline. Month one: you spend 10k acquiring a customer. Months two through five: the customer generates 2.5k per month in gross profit. Month five: total gross profit equals 10k. Payback achieved.
Show the math. Monthly gross margin times payback period equals CAC. If gross margin is 2.5k and payback is four months, CAC is 10k. Your board understands this. It's revenue divided by time. Simple.
Compare to benchmarks. Series A SaaS typically has twelve to eighteen month payback. You're at four months. You're way ahead. Or you're at twenty months. You're in trouble. Context matters.
.jpeg)
Attribution Uncertainty: The Honest Conversation
Your board will ask: how much of our revenue actually came from PPC. It's a good question. And the honest answer is: we don't know exactly, but here's how we're thinking about it.
Explain your attribution model. You use last-touch. This means the most recent touchpoint gets credit. A customer saw your Google Ad three months ago. Last month they downloaded a white paper. This month they closed. The white paper gets credit.
Acknowledge the bias. This undervalues PPC because the ad sparked the initial interest but didn't get credit. How much undervalues it. Probably twenty to thirty percent.
Adjust your numbers. You report 250 customers from PPC using last-touch attribution. But you acknowledge this probably undercounts awareness channels by thirty percent. So the real number is closer to 325 customers. Report both. Raw number and adjusted number. Your CFO respects this transparency.
Preparing for the Tough Questions
Your board will ask hard questions. Prepare answers.
"Why is your CAC increasing." Because competition increased. Cost per click went up fifteen percent. Conversion rate improved ten percent. Net result: CAC up five percent. Show the waterfall. Show what changed and what offset it.
"Should we increase PPC spend." Only if payback remains under twelve months and we have hiring capacity to absorb incremental pipeline. If both are true, yes. If either is false, no. You're not guessing. You're applying criteria.
"How do we know this is working." Three ways. One, pipeline attribution. Two, payback math. Three, cohort analysis showing customers acquired via PPC have similar LTV to organic customers. If all three check out, it's working.
"What happens if CAC keeps rising." We have three levers: increase conversion rate, shift to lower-cost channels, or accept higher CAC if payback remains acceptable. We're working on all three.
Prepare the answers before the meeting. Write them down. Practice them. When your board asks, you have a confident response. That's how you build credibility.
The CFO Conversation: Speaking Their Language
Your CFO cares about one thing: cash flow. PPC spend is cash outflow today. Revenue is inflow later. The time between is what your CFO thinks about.
Show them the timeline. Spend 500k in month one. Recover it over months two through five through customer gross profit. Show the monthly cash position. This is how your CFO thinks. Show them you think the same way.
Tie payback to hiring. If payback is four months, you can hire aggressively. New hire costs 100k. They need to generate 100k in revenue within their first year to break even. With four-month payback, you can confidently hire. With twenty-month payback, you can't. Your CFO understands this immediately.
Show the sensitivity. If payback increases to six months, what changes. If CAC increases twenty percent, does payback still work. Show stress scenarios. Show you've thought about downside. Your CFO respects risk management.
The Board Presentation: Fifteen Minutes to Credibility
You have fifteen minutes. Here's the structure.
Slide one: headline. 500k spent. 250 customers acquired. Four-month payback. Working or not working. That's your answer.
Slide two: CAC by channel. Google Ads at 10k. LinkedIn at 8k. Retargeting at 6k. This shows efficiency. Shows you're thinking about mix.
Slide three: payback detail. Timeline showing monthly gross profit. Formula showing math. Benchmark comparison.
Slide four: attribution and adjustments. Last-touch model. Thirty percent undercount adjustment. Raw and adjusted numbers.
Slide five: next quarter. Scaling PPC spend because payback is strong. Testing new channels because CAC is rising. Forecast showing new CAC and payback.
One story. Five slides. Fifteen minutes. By the end, your board knows: is PPC working, how you know, and what you're doing next.
Frequently Asked Questions
What is Customer Acquisition Cost (CAC) and why is it important for SaaS companies?
CAC is total PPC spend divided by new customers acquired. It matters because it determines if your acquisition is profitable. A 10k CAC with 50k ACV and four-year lifetime is sustainable. A 10k CAC with 15k ACV is problematic. CAC reveals whether your marketing economics work.
How do you calculate CAC for a SaaS business?
Sum all PPC spend for a period. Count new customers acquired from PPC during that period. Divide spend by customers. If you spent 100k and acquired 10 customers, CAC is 10k. Critical: accurately track which customers came from PPC using your CRM and attribution system.
What factors influence the payback period for CAC in SaaS companies?
Payback equals CAC divided by monthly gross margin per customer. A 10k CAC with 2.5k monthly margin equals four-month payback. Factors that reduce payback: higher margins, lower CAC, better conversion rates. Factors that increase payback: lower margins, rising CAC, competition.
How can SaaS companies effectively present PPC efficiency to their board?
Lead with CAC and payback. Show them in simple terms: how much you spend, how long to recover, what that means for scaling. Use visuals. Use benchmarks. Use comparisons to their ACV and margins. Avoid jargon. Speak in dollars and time.
What are the best practices for structuring a board pack for Series A+ SaaS companies?
Five slides: headline (working or not), CAC by channel (efficiency), payback detail (math and timeline), attribution (honesty about uncertainty), next quarter (forward plan). Each slide answers one question. No vanity metrics. No activity reporting. Just business outcomes.
How can attribution uncertainty impact the understanding of PPC effectiveness in B2B journeys?
Long B2B sales cycles mean multiple touchpoints. Last-touch undervalues PPC awareness. Multi-touch is complex. Impact: you don't know true PPC contribution. Solution: acknowledge the bias, adjust numbers, show both raw and adjusted, build credibility through honesty not claims of perfection.
What strategies can be used to tie PPC spend directly to revenue outcomes?
Use cohort analysis: customers acquired via PPC in month one, track their revenue in months two through twelve. Compare to organic cohorts. If similar LTV, PPC is working. Use CAC payback: if payback is under twelve months, revenue is recovering acquisition cost. Both tie PPC to revenue clearly.
How can VPs of Marketing communicate the value of PPC efforts to the CFO?
Speak their language: cash flow and time. Show monthly cash position from PPC cohorts. Show payback timeline. Show relationship between payback and hiring capacity. Show sensitivity to CAC and payback changes. Your CFO cares about cash timing. Make that your focus.
What metrics should be included in a board pack to demonstrate ROI from PPC campaigns?
CAC. Payback period. Pipeline attribution percentage. Win rate by source. Comparison to benchmarks. Cohort LTV analysis. Future forecast. These five together show ROI. Everything else is supporting detail that answers tough questions.
How can SaaS companies simplify complex performance metrics for board presentations?
Use stories and timelines instead of ratios. Use visuals instead of tables. Use simple language instead of jargon. Connect metrics to business outcomes: payback determines hiring, CAC determines profitability, attribution determines strategy. Make the abstract concrete.
---