Building a CAC Reduction Plan Without Killing Growth
Reduce CAC in SaaS without stalling growth. Learn how to cut waste, protect demand, and rebalance paid media, CRO, and measurement safely.

The board wants CAC down. Your instinct is to cut spend. And that’s where most SaaS teams make the mistake.
Cutting spend reduces CAC on paper, immediately. It also reduces pipeline, learning velocity, and the demand engine you spent months building. Three quarters later, the board is asking a different question: where did the pipeline go? Building a Scale-Ready SaaS PPC Engine After PMF: From Ad-Hoc to Operating System, also on this blog, takes this further.
Real CAC reduction is not about spending less. It’s about spending better. The two can look identical in month one and produce entirely different outcomes by month six.
This article walks through how to build a CAC reduction plan that actually works: one that identifies real waste, improves conversion efficiency, and protects the growth optionality you’ll need when the pressure eases.
Why Most SaaS CAC Reduction Efforts Fail
The most common mistake is treating CAC as a budget problem when it’s almost always a quality problem.
Teams see CAC rising and immediately look at spend. They cut budget, pause campaigns, and reduce investment in channels that haven’t yet matured. Lead volume drops. Sales notices. Pipeline slows. CAC stabilises temporarily, but the underlying inefficiency is still there. When budget is restored, the same CAC comes back.
The reason: they cut demand, not waste.
High CAC in B2B SaaS is rarely caused by spending too much. It’s caused by spending on the wrong things, poor conversion across the funnel, or weak customer quality that makes the unit economics look worse than they are. Cutting budget is the bluntest possible response and the one least likely to fix the actual problem.
According to the Benchmarkit 2025 SaaS Performance Metrics report, the median new customer CAC ratio increased from $1.76 in 2023 to $2.00 in 2024, meaning companies are now spending $2.00 in sales and marketing to acquire $1.00 of new ARR. That’s a structural efficiency problem. Budget cuts don’t solve structural problems.
The Three CAC Levers (and Which to Pull First)
Before building a reduction plan, it helps to be precise about where CAC inefficiency actually lives. There are three levers, and they are not equal.
Cost. The raw amount you’re spending to generate pipeline. This is the lever most teams reach for first, and the most dangerous one to pull without context. Spend cuts are immediate and visible. Their consequences are delayed and harder to attribute.
Conversion. How efficiently your spend converts into qualified pipeline. A landing page converting at 2% improving to 4% cuts your cost per lead in half without touching budget. Conversion improvements compound. They don’t decay like budget cuts.
Customer quality. The ICP fit of the customers you’re acquiring. If a significant portion of your closed deals churn early, have low ACV, or take six months to close with sales teams that never want to touch the lead again, your CAC calculation is telling you something about targeting, not spend.
Most SaaS teams should start with conversion and quality before touching cost. The order matters because conversion improvements require test cycles and time to validate, while cost cuts are irreversible in the short term. Start with the levers you can pull back.
A Five-Step CAC Reduction Framework
Step 1: Fix Measurement Before Making Any Cuts
This is non-negotiable, and it’s the step teams skip most often.
Before you can reduce CAC, you need to be confident you’re measuring it correctly. The most common attribution errors in B2B SaaS: assigning CAC to the wrong time period, not including all sales and marketing costs (headcount is the biggest omission), and conflating blended CAC with new logo CAC.
Blended CAC includes expansion revenue in the denominator. It will always look healthier than new logo CAC. The Benchmarkit data shows a blended CAC ratio of $1.40 versus a new logo CAC ratio of $2.00. If you’re making budget decisions based on blended figures, you’re optimising for the wrong number.
Fix your CAC model first: fully loaded sales and marketing costs, new logos only, aligned to the right time window. Then look at the number. You may find the CAC problem is smaller than it appeared, or larger, but at least you’re working with real data.
Step 2: Identify Spend Producing Volume but Weak Pipeline Quality
Not all pipeline is equal, and not all spend that produces pipeline is worth keeping.
Pull a 90-day cohort of leads and trace them to closed-won. Where are the deals? Where are the leads that sales declined to work, churned early, or are still stalled in pipeline six months later? Map that distribution back to campaign, keyword, audience, and creative.
This exercise usually reveals one of two things: either a small number of campaigns are generating the majority of good pipeline (the rest is waste), or a specific channel is generating volume that looks healthy until you look at downstream quality.
In paid search, this often shows up as informational query traffic converting to form fills but never progressing to qualified opportunities. The CPL looks acceptable. The cost-per-opportunity is astronomical.
Spend that consistently produces low-quality pipeline is not worth protecting. This is where cuts are appropriate, and they can be made with confidence rather than as a hedge against board pressure.
Step 3: Improve Conversion Efficiency Before Scaling Back
Once you’ve identified where quality pipeline comes from, the next question is: how much of that pipeline are you leaving on the table through conversion inefficiency?
In paid media, the conversion chain runs from search query to ad click to landing page to form submission to sales qualification. Each step leaks. Most SaaS teams focus on the first two and neglect the last three.
The practical focus areas:
Query pruning. In paid search, broad and phrase match campaigns often accumulate queries over time that were never relevant to your ICP. A monthly negative keyword audit is maintenance, not optimisation. If you’re not doing it weekly during a CAC reduction programme, you’re paying for irrelevant clicks that inflate your CAC figures.
Landing page messaging. ICP mismatch at the landing page level is the single most fixable cause of high CPL. If your ad speaks to a specific pain and the page opens with a generic value proposition, you’re burning ad spend to generate bounces. Alignment between ad copy and page headline is table stakes. Most SaaS teams don’t have it.
Form and flow friction. Long forms on primary landing pages consistently reduce conversion. For a demo request page targeting mid-market SaaS buyers, three to four fields is the ceiling before friction starts costing you leads. If your form is asking for phone number, company size, and annual budget before a prospect has even decided whether your product is relevant, you’re self-imposing a conversion penalty.
Conversion improvements compound in a way that budget cuts cannot. A landing page that moves from 2% to 4% conversion rate halves your cost per lead from existing traffic. For a SaaS company spending £50,000 per month on paid media, that’s a 50% CAC reduction before touching a single bid or budget.
Step 4: Rebalance Channel Mix and Bidding Without Destroying Learning
Once you have clean measurement and a clearer picture of where quality pipeline comes from, you can make informed decisions about channel allocation.
The caution here: bidding strategy resets and campaign consolidations carry a learning period. Google Ads’ Smart Bidding algorithms require sustained conversion data to perform. If you restructure campaigns too aggressively, you restart the learning phase and temporarily increase CPL. This is a common outcome for SaaS teams that cut and restructure simultaneously under board pressure.
The practical rule: make one type of change at a time. If you’re consolidating ad groups or switching bidding strategies, don’t cut budget at the same time. The combined signal disruption makes it impossible to attribute what caused subsequent performance changes.
For channel mix specifically: paid search tends to be the most defensible spend during a CAC reduction programme because it captures existing demand. Paid social, which creates demand rather than capturing it, requires more patience and a longer attribution window. Cutting social demand gen entirely to improve short-term CAC is a common mistake. It saves money now and makes every other channel work harder in six months, because the pipeline you were creating is no longer being built.
Geo focus is another underused lever. If you’re running broad geographic targeting and your ICP is concentrated in a handful of markets, tightening geographic targeting reduces wasted impressions without reducing reach to buyers who matter.
Step 5: Protect High-Intent Demand and Future Growth Bets
The final step is guardrail-setting, not action. Before executing any plan, decide what you will not cut.
Brand campaigns protect your most efficient source of inbound. Prospects actively searching for your product by name are at the highest buying intent. Pausing brand to save budget is almost never justified. The cost of ceding that traffic to competitors is reliably worse than the saving.
Retargeting lists built over the past six months represent engaged prospects who didn’t convert on first touch. These audiences are expensive to rebuild. Pausing retargeting to reduce CAC is a short-sighted trade.
Any test that has a clear hypothesis and hasn’t yet had sufficient data to reach significance should not be killed on budget grounds. Learning velocity is a moat. Teams that maintain it during efficiency programmes come out ahead of those that sacrifice it.

Stage-Aware Guidance
How you reduce CAC depends significantly on where you are in the growth curve.
Series A, early traction. CAC is high and that’s often appropriate. You’re still identifying your ICP and your conversion infrastructure is immature. The priority is not reducing CAC per se, but getting to a point where you can measure it accurately. Attribution needs to be working before efficiency becomes the goal.
Series B, scaling. You have ICP signal and have found channels that work. CAC creep at this stage usually comes from campaign sprawl (too many experiments running simultaneously, diluting budget from proven winners) and landing page entropy (pages that weren’t updated as ICP messaging evolved). These are correctable.
Series C+, efficiency reset. Board pressure at this stage is real and the mandate for efficiency is usually correct. CAC reduction here should be systematic: audit everything, protect proven channels, cut or pause underperformers with clear evidence, and build a repeatable optimisation process rather than a one-time cut.
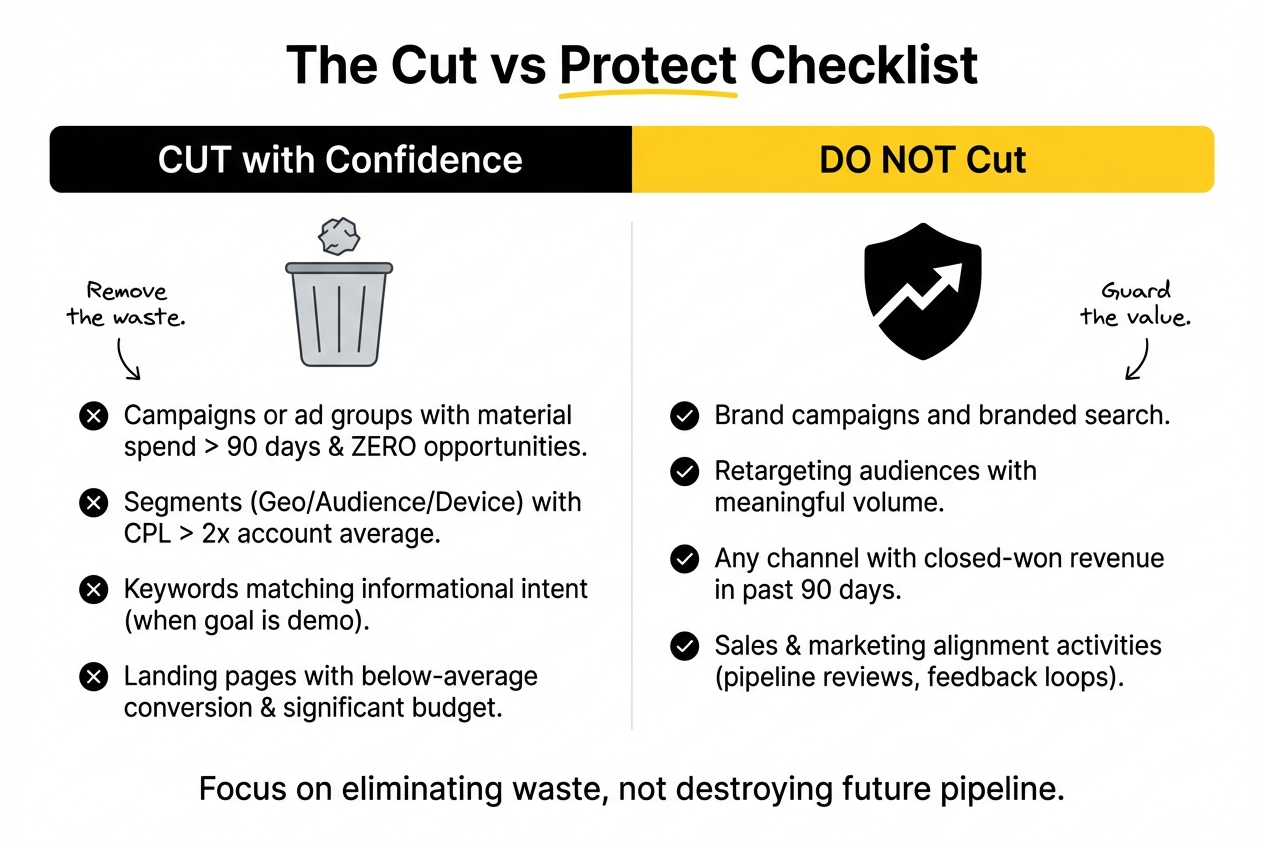
What Not to Cut
The cut vs protect question deserves as much attention as the cuts themselves.
Do not cut:
- Brand campaigns and branded search
- Retargeting audiences with meaningful volume
- Any channel that has produced closed-won revenue in the past 90 days
- Sales and marketing alignment activities (pipeline reviews, lead quality feedback loops)
Cut with confidence:
- Campaigns or ad groups that have spent materially over 90 days with zero opportunities created
- Geo, audience, or device segments with consistent CPL more than 2x your account average
- Keywords matching informational intent when your goal is demo requests
- Landing pages with below-average conversion rates receiving significant budget
Communicating CAC Reduction Plans to Sales and Leadership
CAC reduction creates friction with sales if the plan isn’t communicated well. Sales teams see budget cuts and hear “fewer leads”. That framing is wrong, and worth correcting directly.
The message to sales: the plan is to improve quality, not reduce volume. The short-term signal is that CPL may rise as you exit high-volume, low-quality campaigns. The lagging indicator to watch is MQL-to-SQL ratio. If it improves while CPL increases, the plan is working.
The message to leadership: CAC is a lagging indicator. The leading indicators to watch during a reduction programme are cost-per-opportunity (not cost-per-lead), MQL-to-SQL ratio, and landing page conversion rate. If all three are moving in the right direction, CAC will follow within one to two quarters.
Agree on the leading indicators before starting the plan. This prevents the common situation where CAC hasn’t visibly improved after 60 days and leadership loses confidence in the programme.
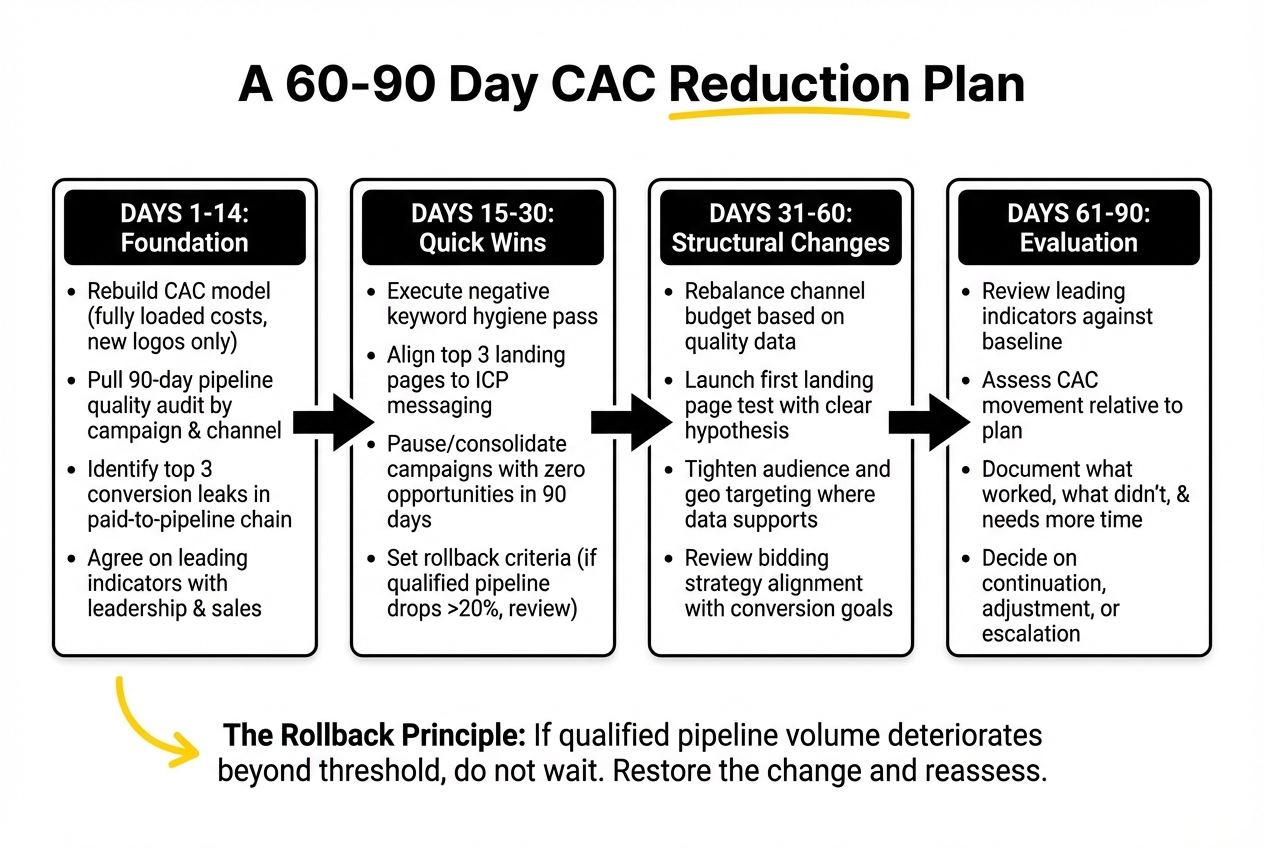
A 60-90 Day CAC Reduction Plan
Days 1-14: Foundation
- Rebuild your CAC model using fully loaded costs, new logos only
- Pull a 90-day pipeline quality audit by campaign and channel
- Identify the top three conversion leaks in the paid-to-pipeline chain
- Agree on leading indicators with leadership and sales
Days 15-30: Quick wins
- Execute negative keyword hygiene pass
- Align top three landing pages to ICP messaging
- Pause or consolidate campaigns with zero opportunities in 90 days
- Set rollback criteria: if qualified pipeline volume drops more than 20%, review
Days 31-60: Structural changes
- Rebalance channel budget based on quality data
- Launch first landing page test with clear hypothesis
- Tighten audience and geo targeting where data supports it
- Review bidding strategy alignment with current conversion goals
Days 61-90: Evaluation
- Review leading indicators against baseline
- Assess CAC movement relative to plan
- Document what worked, what didn’t, and what requires more time to validate
- Decide on continuation, adjustment, or escalation
The rollback principle matters: if qualified pipeline volume deteriorates beyond your agreed threshold, do not wait for CAC to move. Restore the change that caused the drop and reassess. CAC optimisation is not worth buying at the cost of stalled pipeline.
When to Bring in External Support
CAC reduction programmes are harder to execute internally than they look. The reasons are structural: internal teams have institutional familiarity with existing campaigns (which makes it hard to kill them), don’t have benchmarks for what good looks like at their stage, and often lack the conversion expertise to diagnose landing page problems correctly.
An external specialist brings objectivity to the spend audit, external benchmarks for what CPL and conversion should look like, and the ability to execute changes without the internal politics that slow down most teams.
If your CAC is rising despite clean attribution and active optimisation, or if you’ve made cuts and pipeline hasn’t recovered, it’s worth exploring what you’re not seeing. This is the kind of problem we work through with SaaS teams regularly. Explore Upraw’s SaaS PPC work.
Frequently Asked Questions
How can SaaS companies reduce CAC without slowing growth?
Start with conversion and customer quality improvements before cutting spend. Improving landing page conversion rates, tightening ICP targeting, and pruning low-quality campaign spend can reduce CAC without reducing pipeline volume. Protect brand campaigns, retargeting, and any channels with proven closed-won data. Fix measurement first so you’re making decisions based on real unit economics.
What’s the safest way to cut paid media spend when CAC is too high?
Cut spend only where you have 90-day evidence of zero qualified pipeline: campaigns, ad groups, or audience segments with consistent spend and no opportunities created. Avoid blanket budget cuts across campaigns. Make one change at a time to preserve attribution clarity, and set a rollback threshold on qualified pipeline before executing any cuts.
Which CAC levers matter most in B2B SaaS: cost, conversion, or quality?
In most B2B SaaS companies, conversion and quality have more headroom than cost. Improving a landing page from 2% to 4% conversion halves cost per lead from existing traffic. Removing low-quality ICP audiences eliminates spend that inflates CAC without generating viable pipeline. Cost reductions should come last, after conversion and quality improvements have been exhausted.
What should you cut first when CAC is rising?
Start with campaigns and ad groups that have meaningful spend history and zero downstream pipeline quality, not just low CPL. In paid search, informational keywords converting to form fills but not to sales-qualified opportunities are the most obvious first cut. Then review geographic and audience segments with cost-per-opportunity more than twice your account average.
How long does it take to see CAC improvements without harming pipeline?
Conversion improvements typically show within 30-45 days. Attribution and spend rebalancing take one to two full quarters to reflect in CAC, because the denominator (new customer count) moves slowly. Agree on leading indicators with leadership before starting the plan. MQL-to-SQL ratio and cost-per-opportunity will move before CAC does.
How do you explain CAC reduction plans to sales and the board?
Tell sales the plan improves quality, not reduces volume, and ask them to watch MQL-to-SQL ratio rather than total lead count. Tell leadership that CAC is a lagging indicator and agree on the leading metrics that will signal whether the plan is working before it shows up in CAC. Pre-aligning on leading indicators prevents premature loss of confidence in the programme.
When does CAC reduction signal a need for external paid media support?
When CAC continues to rise despite active optimisation, when internal teams lack benchmarks to distinguish normal CAC levels from structural problems, or when cuts have been made but pipeline hasn’t recovered. External support brings objectivity to spend audits, conversion benchmarks from comparable SaaS companies, and the ability to execute changes without internal institutional bias toward existing campaigns. For further reading, see our guide on how to reset SaaS growth efficiency.

.png)
