Connecting Paid Media Touchpoints to Pipeline and Unit Economics
A five-link framework for connecting paid media touchpoints to qualified pipeline, CAC, payback and lifetime value, with evidence tiers that keep attribution claims honest.

The board doesn’t ask how many clicks LinkedIn drove last quarter. It asks what a pound spent there actually buys, and whether the next pound will buy the same.
Most SaaS marketing teams can’t answer that cleanly. Connecting paid media to pipeline metrics sounds like an attribution problem, so teams spend months arguing over models. Meanwhile the question finance actually cares about goes unanswered: what does each channel cost per qualified opportunity, per customer and per month of payback?
This article sets out a practical way to answer it. The method runs from touchpoint to unit economics, with an honest label on how confident each number is. The goal isn’t perfect attribution. It’s a set of numbers precise enough to make budget decisions and robust enough to survive a CFO’s questions.
What It Means to Connect Paid Media to Pipeline and Unit Economics
Connecting paid media touchpoints to pipeline and unit economics means expressing each channel’s spend in the terms finance uses: cost per qualified opportunity, customer acquisition cost, payback period and the lifetime value of the customers it brings in. It does not mean crediting every closed deal to a single ad.
The distinction matters. A channel can look expensive on cost per lead and still produce the best unit economics in the account, because it brings in larger deals or customers who stay longer. Measuring ROI of paid media touchpoints only becomes useful when you follow the money all the way to the customer.
Why Attribution Precision Is the Wrong Goal
B2B journeys are now too long and too fragmented for any model to assign credit precisely. Dreamdata’s 2026 LinkedIn Ads Benchmarks Report found the average B2B customer journey stretched to 272 days from first marketing touch to closed revenue. Across nine months, a buying committee will read, share and discuss your content in places no pixel can see.
That creates two structural gaps:
- Dark social challenges. Buyers share posts in Slack, forward screenshots in WhatsApp and recommend vendors on podcasts. None of it carries a UTM, so the influence of your paid social budget is systematically under-reported.
- Cross-device tracking. A VP sees an ad on their phone, researches on a work laptop and books a demo from a different browser weeks later. Consent rules and cookie loss mean those touches rarely join up at the person level.
Even the best tools only estimate. Dreamdata’s own 2026 figures put LinkedIn’s return on ad spend at 121%, against 67% for Google Search and 51% for Meta. Those figures come from Dreamdata’s data-driven model, and a different model would rank the channels differently. That doesn’t make the data useless. It means you should treat attribution as directional evidence, not as an accounting ledger.
The choice of model for long cycles is a separate question, and we’ve covered it in our guide to channel influence in long SaaS sales cycles. This article focuses on what you do with the evidence once you have it.
The Touchpoint-to-Unit-Economics Chain
The most reliable way of linking paid media channels to qualified pipeline and unit economics is to build a chain of five links. Each link converts the output of the previous one into something closer to revenue:
- Touchpoints: spend and engagement from ICP accounts
- Qualified pipeline: sales-accepted opportunities created from those accounts
- Opportunity value: average deal size multiplied by win rate
- Customer acquisition cost: spend divided by customers won
- Payback and lifetime value: how quickly each customer repays their cost, and what they’re worth over time
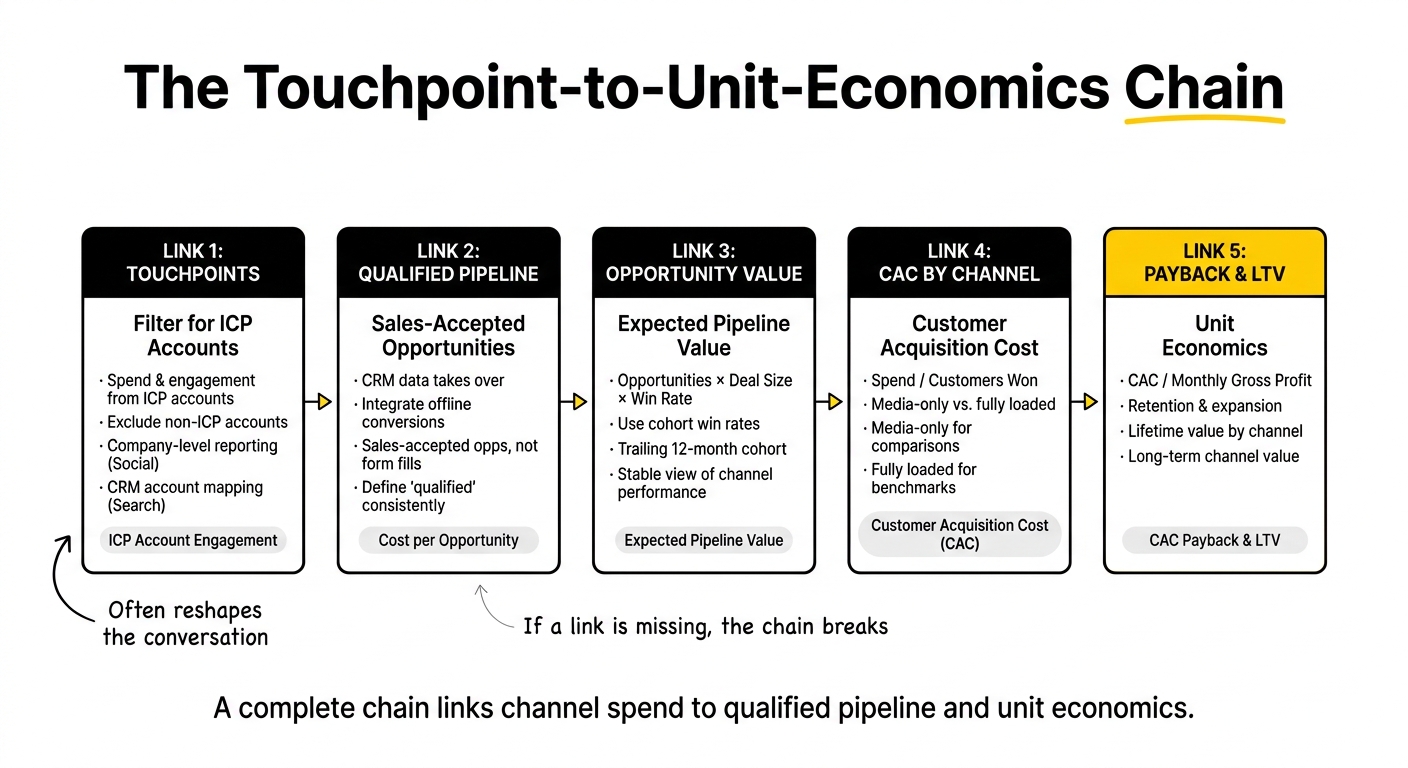
If any link is missing, the chain breaks and the channel gets judged on whatever metric happens to be available. That’s usually cost per lead, which is the least useful number in the list.
Link 1: Touchpoints From the Right Accounts
Start by filtering. Spend that reaches non-ICP accounts can’t produce ICP pipeline, so separate engagement from target accounts from everything else. For paid social, that means company-level engagement reporting. For search, it means mapping converting leads back to account firmographics in your CRM.
This step alone often reshapes the conversation. A channel generating cheap leads from companies you’d never sell to looks very different once those leads are excluded.
Link 2: Qualified Pipeline in the CRM
The second link is where platform data ends and CRM data takes over. Integrate offline conversion data so that sales-accepted opportunities, not form fills, are the outcome each channel reports against. Google Ads and LinkedIn both accept CRM stage imports, and feeding them back improves bidding as well as reporting.
Define “qualified” once and apply it everywhere. If marketing counts an SQL at first meeting and sales counts it at discovery, your cost per opportunity will never reconcile.
Link 3: Opportunity Value
Not all pipeline is equal. Multiply each channel’s opportunities by its average deal size and its historical win rate to get expected pipeline value.
Use cohort win rates rather than last quarter’s closes. With long sales cycles, deals closing this quarter were sourced two or three quarters ago, so a trailing 12-month cohort gives a far more stable view of each channel.
Link 4: Customer Acquisition Cost by Channel
Divide channel spend by the customers it won to get a cost per acquisition (CAC) measured at the customer level. Be explicit about whether this is media-only CAC or fully loaded CAC, which includes sales salaries, tools and agency fees. Media-only CAC is useful for comparing channels. Fully loaded CAC is what the board benchmarks against.
For context, the 2026 Aleph and Benchmarkit SaaS Performance Benchmarks report puts median B2B SaaS CAC payback at 16 months on a fully loaded basis, down from 18 months in 2024. Don’t compare a media-only figure against that benchmark, or your numbers will look implausibly good.
Link 5: Payback and Lifetime Value
The final link converts CAC into time and value. Payback is CAC divided by monthly gross profit per customer. Lifetime value adds retention and expansion. This is where unit economics in paid media strategies becomes a real argument rather than a spreadsheet exercise.
A Worked Example: When the “Expensive” Channel Wins
Take a hypothetical Series B analytics platform with a £50,000 monthly paid budget, an 80% gross margin and two main channels.
Paid search:
- £30,000 spend, 25 qualified opportunities: £1,200 per opportunity
- 25% cohort win rate: about 6 customers a month, media CAC of £4,800
- Average deal size £24,000 a year: £1,600 monthly gross profit, so a 3.0-month media payback
LinkedIn:
- £20,000 spend, 10 qualified opportunities: £2,000 per opportunity
- 20% cohort win rate: 2 customers a month, media CAC of £10,000
- Average deal size £48,000 a year: £3,200 monthly gross profit, so a 3.1-month media payback
On cost per opportunity, LinkedIn looks 67% more expensive. On payback, the two channels are level. If the larger LinkedIn accounts also retain and expand better, which is common in mid-market deals, LinkedIn produces higher lifetime value per pound spent.
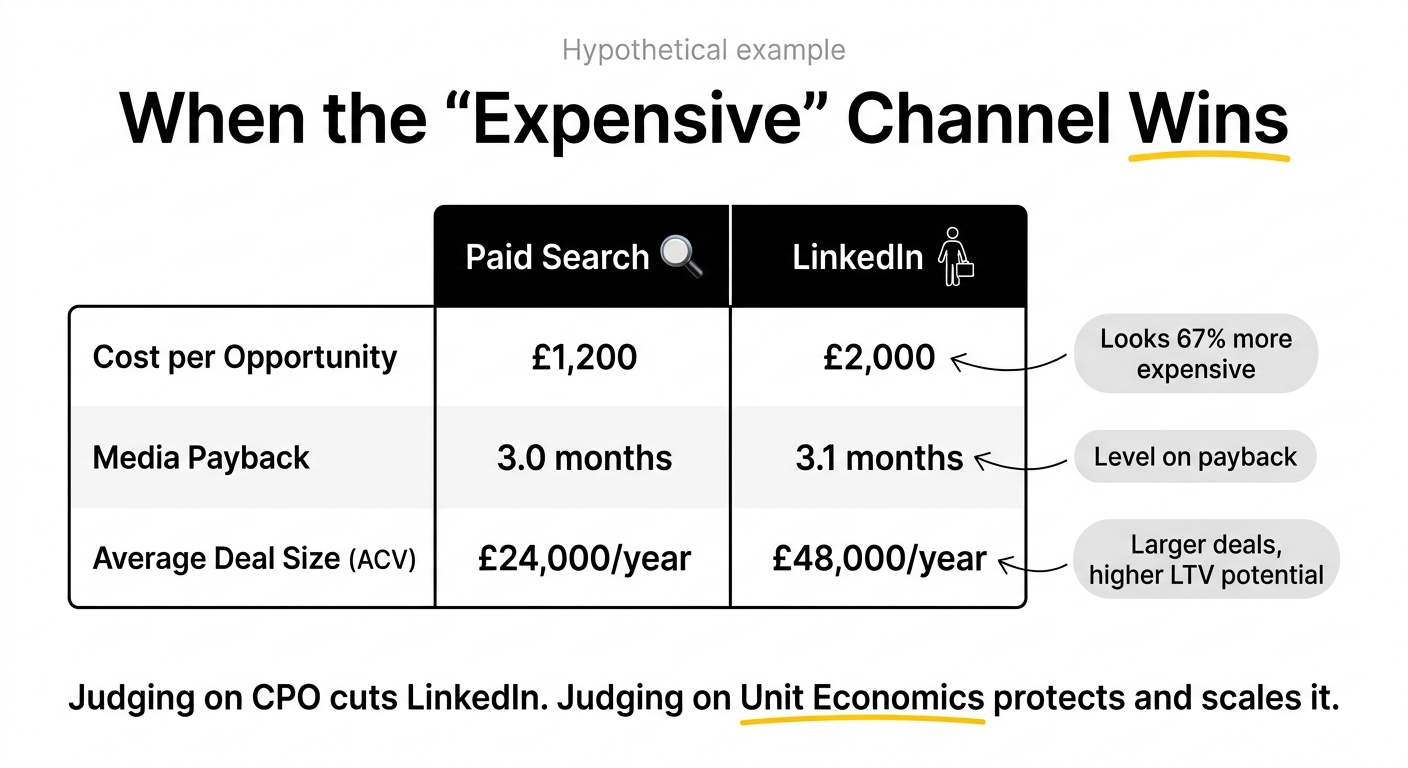
A team judging on cost per opportunity would cut LinkedIn. A team judging on unit economics would protect it and investigate how to scale it. That’s the actionable insight the chain exists to surface.
Evidence Tiers: Reporting Without Overstating Precision
Not every number in the chain carries the same confidence. Instead of pretending otherwise, label each channel’s result by the strongest evidence behind it:
- Measured: touchpoints matched to CRM opportunities through offline conversion imports or account-level journey data. This is the highest confidence tier, but it undercounts dark social influence.
- Influenced: opportunities from accounts that engaged with paid media before converting, plus self-reported attribution (“How did you hear about us?”) on demo forms. This is medium confidence, and it’s where most paid social impact shows up.
- Tested: lift measured through holdouts, geo splits or planned spend pauses. This is the strongest causal evidence, but it’s slow and expensive, so reserve it for your largest budget lines.
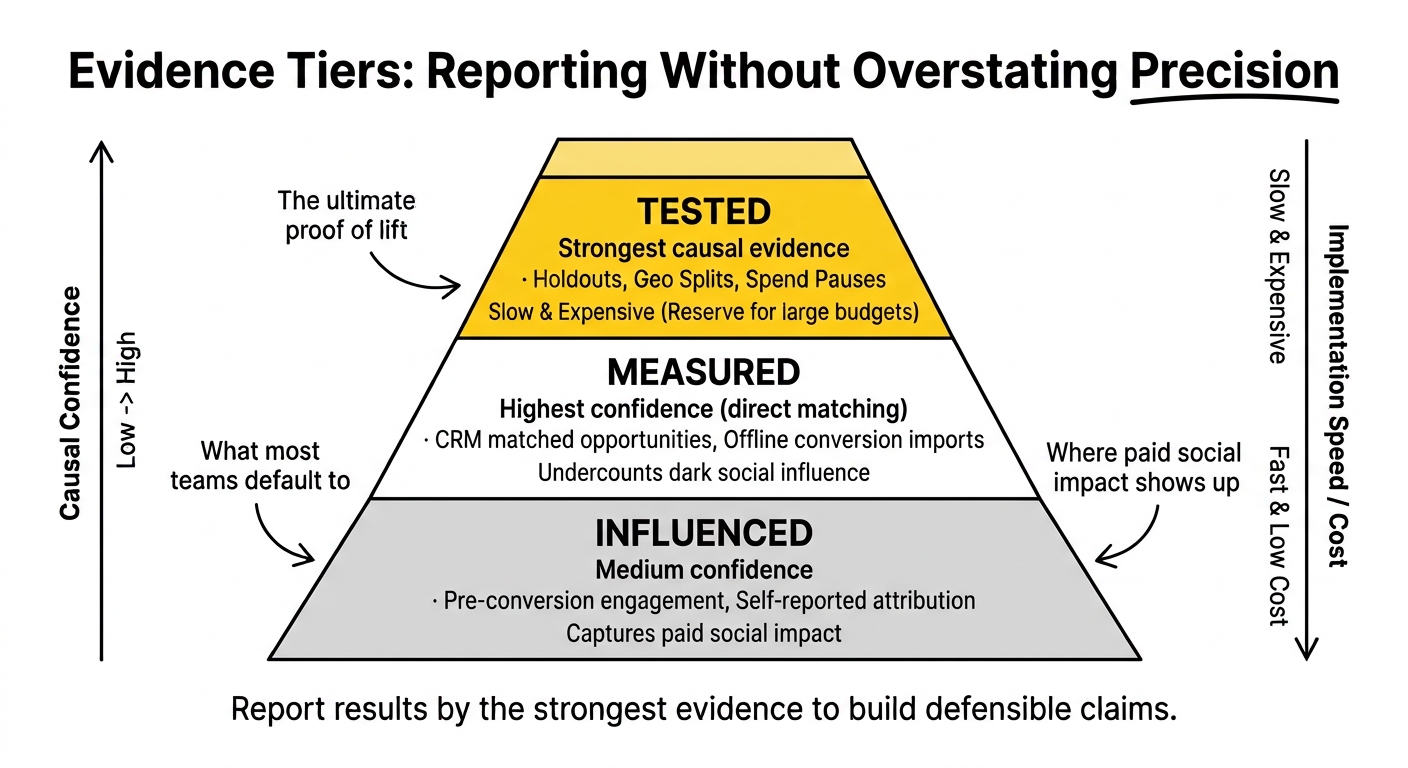
Reporting a channel as “£2,000 per qualified opportunity, measured, with influenced pipeline suggesting a further 30 to 50%” is more defensible than any single-number claim. It also answers the objection finance raises most often, that marketing overstates its own impact, before anyone raises it.
Multi-Stakeholder Journeys: Measure Accounts, Not Leads
Buying committees make lead-level measurement misleading. The person who clicks your ad is often not the one who signs, and the one who signs may never have touched a campaign at all.
Roll touchpoints up to the account and ask a better question: did paid media reach the buying committee before the opportunity opened? In practice, that means:
- Tracking engaged roles within target accounts, not just engaged individuals
- Tailoring messaging by role, with economic buyers, technical evaluators and end users each seeing different proof
- Counting an opportunity as paid-influenced when multiple committee members engaged beforehand, even if the converting lead came through organic search
This is also the most practical answer to cross-device and dark social gaps. You don’t need to stitch every device together if you can see that the account as a whole engaged.
Balancing Brand Positioning With Performance Metrics
Demand creation and demand capture have different unit economics timelines, and judging them on the same scorecard starves the one that pays back slowly. Structure campaigns so each motion carries its own performance metrics in marketing reports:
- Capture campaigns (high-intent search, competitor terms, retargeting): judged on cost per qualified opportunity and media payback, reviewed monthly
- Creation campaigns (paid social thought leadership, video, upper-funnel audiences): judged on ICP account reach, engagement depth and pipeline from engaged accounts, reviewed quarterly
- Bridge campaigns (retargeting engaged accounts with conversion offers): judged on how efficiently they convert created demand into pipeline
This structure lets you defend brand spend with evidence rather than faith. When creation-campaign accounts start converting through capture campaigns at a lower cost per opportunity, you have a measurable link between the two.
Turning Unit Economics Into Budget Decisions
Averages hide the decision that matters. A channel’s average CAC tells you how it performed. Its marginal CAC, the cost of the next customer, tells you whether more budget will help.
For budget decisions, CMOs get more from three questions than from any dashboard:
- Where is payback shortest, and is volume still available there? Scale that first.
- Where does marginal CAC rise fastest as spend increases? That’s your ceiling, usually in branded and high-intent search.
- Which channel has the highest lifetime value per pound, even with slower payback? Fund it within the payback limit your cash position allows.
Continuous testing keeps these answers current. Budget shifts of 10 to 20% between channels, held for a full cohort cycle, will tell you more about marginal returns than any attribution model.
How to set budget splits against payback targets is a topic in its own right, covered in our forthcoming guide, SaaS Budget Splits by CAC Payback Period. For the measurement setup that makes all of this possible, see our SaaS analytics approach.
Building a Board-Ready Narrative
A data-driven SaaS CMO doesn’t win budget arguments with more charts. They win them with a clear chain from spend to value. A one-page structure works for most boards:
- What we invested: spend by channel and motion (capture, creation, bridge)
- What it created: qualified pipeline and expected pipeline value by channel
- What it’s worth: CAC, payback and lifetime value per channel, each labelled with its evidence tier
- What we’ll change: the specific reallocation next quarter and the metric that will confirm it worked
Keep the uncertainty on the page. Boards trust ranges with clear evidence far more than precise figures they suspect were reverse-engineered.
The Upraw Perspective
Most attribution debates in SaaS are proxy arguments about budget. Teams fight over first-touch versus data-driven models because the model decides who gets credit, and credit decides who gets money.
Moving the conversation to unit economics ends most of those fights. Finance doesn’t care which touch gets credit. It cares whether a pound in LinkedIn or a pound in search returns more gross profit, and how fast. Answer that with honest confidence labels, and attribution becomes a supporting input rather than the whole argument.
Frequently Asked Questions
How can SaaS CMOs effectively connect paid media touchpoints to qualified pipeline?
Feed CRM opportunity stages back into ad platforms through offline conversion imports, then report each channel against sales-accepted opportunities rather than form fills. Filter touchpoints to ICP accounts, apply one shared definition of “qualified” across marketing and sales, and roll engagement up to the account level. This creates a consistent link from spend to pipeline that holds up in finance reviews.
What role do long sales cycles play in the attribution of paid media investments?
Long sales cycles mean the deals closing this quarter were influenced by spend two or three quarters ago. That makes quarterly closed-won a poor measure of current campaigns. Use qualified opportunities as the near-term outcome and trailing 12-month cohort win rates to estimate value, so channel decisions aren’t distorted by timing lags.
How can CMOs navigate the complexities of multi-stakeholder journeys in their marketing strategies?
Measure accounts, not individuals. Track which roles in each target account engaged with paid media before an opportunity opened, and tailor messaging to economic buyers, technical evaluators and end users separately. Count opportunities as paid-influenced when several committee members engaged beforehand, even if the converting lead arrived through another channel.
What are the challenges of dark social and cross-device tracking in measuring media effectiveness?
Dark social, such as private messages, communities and podcasts, carries no tracking, so paid social influence is under-reported. Cross-device journeys break person-level tracking because consent rules and cookie loss stop touches from joining up. Account-level measurement, self-reported attribution fields and periodic lift tests are the most practical ways to recover a directional view of that influence.
How can CMOs translate media investments into actionable insights for their teams?
Convert every channel’s results into the same five-link chain: touchpoints, qualified pipeline, opportunity value, CAC and payback. When channels are compared on payback and lifetime value rather than cost per lead, the actions become clear: scale what pays back fastest, cap what hits rising marginal CAC, and protect channels that bring higher-value customers.
What metrics should CMOs focus on to demonstrate the link between acquisition efforts and revenue growth?
Focus on cost per qualified opportunity, expected pipeline value, CAC by channel, CAC payback period and lifetime value by acquisition source. State whether CAC is media-only or fully loaded, and label each figure with its evidence tier. Together, these show how acquisition spend turns into revenue without relying on click or lead volumes.
How can CMOs balance brand positioning with performance metrics in their marketing strategies?
Give each motion its own scorecard. Judge capture campaigns on cost per opportunity and payback monthly, and judge creation campaigns on ICP account reach, engagement and pipeline from engaged accounts quarterly. Then track whether accounts reached by creation campaigns convert more cheaply through capture campaigns. That link is the evidence for brand investment.
What tools or frameworks can help CMOs create a board-ready narrative around their marketing efforts?
A one-page structure works well: what was invested, what it created, what it’s worth and what will change next quarter. Support it with CRM-integrated journey data, offline conversion imports and an evidence tier for each channel (measured, influenced or tested). Boards respond better to honest ranges with clear sources than to single precise figures.
How can data-driven insights inform budget decisions for paid media investments?
Use marginal rather than average CAC. Test budget shifts of 10 to 20% between channels over a full cohort cycle to see where the next customer costs least. Scale channels with short payback and available volume, cap those where marginal CAC climbs quickly, and fund higher-lifetime-value channels within the payback limit your cash position allows.
What are the best practices for measuring the impact of paid media on unit economics?
Connect platforms to CRM stages, measure at the account level, and use cohort win rates to value pipeline. Separate media-only CAC from fully loaded CAC before benchmarking. Calculate payback on gross profit, not revenue. Reserve holdout or geo tests for the largest budget lines, and report every channel with a clear label on how confident each number is.
Putting It to Work
Pick your two largest channels and run them through the five-link chain this month. Most teams find at least one budget line they’ve been judging on the wrong number.
This is the kind of measurement work we build with SaaS teams through our SaaS analytics practice. If it would help to pressure-test your channel economics before the next board meeting, we’re happy to take a look.