Predicting Pipeline Performance from PPC in B2B SaaS
A practical framework for forecasting pipeline performance from PPC in B2B SaaS, covering intent buckets, conversion rates, and what predictive analytics can and can’t reliably tell you.

Your PPC campaigns are generating clicks. The platform data looks reasonable. Now someone in a leadership meeting asks: “So what pipeline are we expecting next quarter?”
Most marketing ops teams either guess, or they produce a number they can’t defend when the pipeline doesn’t show up. Neither is a good position to be in.
PPC pipeline forecasting in B2B SaaS is genuinely possible, but only within specific boundaries. Understanding those boundaries is what separates a forecast that holds up to scrutiny from one that collapses the moment sales pushes back. This article walks through what you can predict with reasonable confidence, where the signal degrades, and how to build a forecasting approach that survives a board-level conversation.
What PPC Forecasting Actually Means in B2B SaaS
Before building a framework, it helps to be clear on what forecasting pipeline performance from PPC actually involves.
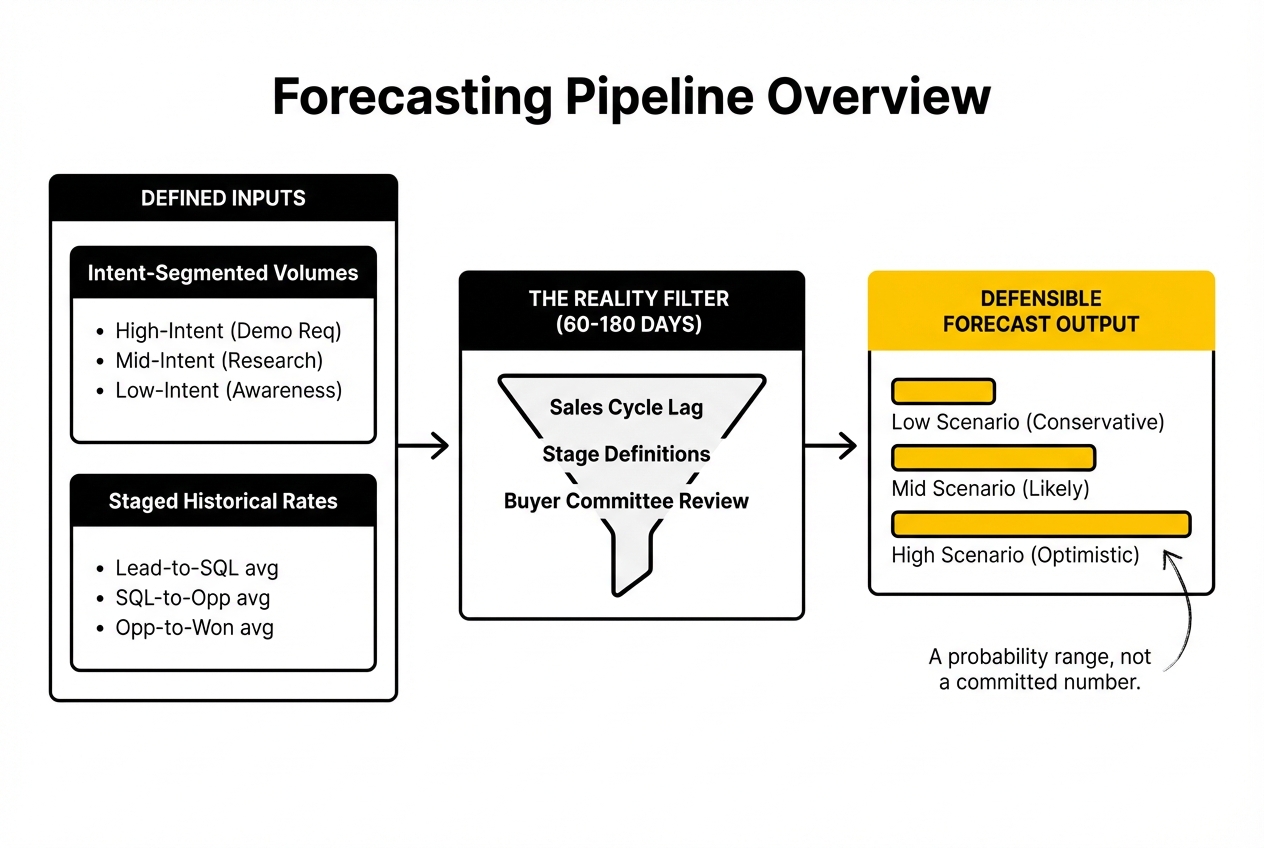
You are not predicting exact closed-won revenue from a specific campaign. You are building a probability model: given historical conversion rates at each stage of the funnel, current lead volumes, and a known sales cycle, what range of pipeline value is the current PPC activity likely to generate over a defined period?
That distinction matters. A forecast is a directional range with stated assumptions, not a committed number. Teams that present PPC forecasts as precise revenue predictions create problems for themselves when deals slip or conversion rates shift. The goal is a defensible model, not false precision.
The inputs you need to make this work are: intent-segmented lead volumes, stage-by-stage conversion rates, average sales cycle length by segment, and average contract value. If any of those are missing or unreliable, the forecast degrades accordingly.
The Role of Intent Buckets in Refining Your Forecast
Not all PPC traffic converts at the same rate, and treating it as if it does is one of the most common forecasting errors in B2B SaaS marketing.
Intent buckets segment your paid traffic by how close buyers are to an active purchase decision. At the most basic level, this breaks into three groups:
- High-intent signals: Searches for branded terms, direct solution comparisons (“best [category] software”), demo or trial requests. These leads convert to SQL at the highest rates and move fastest through the sales cycle.
- Mid-intent signals: Category-level searches, feature-specific queries, problem-aware terms. These buyers are in research mode. Conversion rates are lower and the lag between lead and pipeline entry is longer.
- Low-intent signals: Broad awareness traffic, retargeting audiences, content-driven paid social. Pipeline contribution here is real but indirect, and attribution is harder.
For forecasting purposes, high-intent traffic is where your numbers are most reliable. If your campaigns are primarily capturing high-intent search demand, you have the cleanest signal. If you are running a mix of capture and generation activity, you need separate conversion rate models for each bucket rather than a blended average.
Blending conversion rates across intent buckets is where most forecasts go wrong. A 3% lead-to-opportunity rate sounds usable until you realise it is averaging a 12% rate from demo requests with a 0.8% rate from top-of-funnel content downloads. Separating those out produces much sharper stage-by-stage projections.
Conversion Rates in B2B SaaS: Building Forecasting Accuracy Stage by Stage
The conversion rate question is not “what is our lead-to-close rate?” It is “what is our conversion rate at each stage, and how stable is it over time?”
For a B2B SaaS pipeline forecast to hold up, you need reliable conversion data at a minimum of three points:
- Lead (or form fill / demo request) to SQL
- SQL to Opportunity
- Opportunity to Closed-Won
Each stage has its own dynamics. Lead-to-SQL conversion is heavily influenced by lead quality, which varies by intent bucket, campaign type, and the quality of your qualifying questions or scoring model. SQL-to-Opportunity is largely a sales execution variable, though marketing can affect it through landing page quality and the expectation-setting that happens before a prospect talks to a rep. Opportunity-to-Closed-Won is primarily in sales territory.
For forecasting to be meaningful, you need at least three months of consistent stage data, ideally six. That gives you enough volume to identify a real rate rather than statistical noise. If you have just launched new campaign types or significantly changed your ICP targeting, your historical conversion rates may not apply to current traffic, and you need to flag that in your model.
Where a lot of marketing ops teams run into trouble is using CRM data without checking whether stage definitions are being applied consistently by the sales team. A lead-to-SQL conversion rate is only reliable if “SQL” means the same thing across every rep who touches deals. If stage definitions are loose, clean up the CRM logic before building forecasts on top of it. Reliable forecasting depends on data integrity, not just analytical sophistication. How to Build a SaaS PPC Engine for B2B SaaS (Not Just Run Ads), also on this blog, takes this further.
Sales Cycle Stages and the Time Lag Problem
Even with clean conversion rates, pipeline forecasting in B2B SaaS has a built-in timing challenge: the lag between a PPC lead entering the funnel and that lead contributing to measurable pipeline can be measured in months, not days.
Enterprise-targeted SaaS deals do not close in 30 days. For most B2B SaaS companies at Series A and above, the average sales cycle from first touch to closed-won sits somewhere between 60 and 180 days depending on ACV, buying committee size, and whether the product requires a security or procurement review.
This has two practical implications for forecasting.
First, the pipeline you are forecasting from today’s PPC activity will largely show up in a different quarter. A CMO who asks “what pipeline will we see this quarter from our current PPC spend?” may be asking the wrong question. The more useful framing is: “What does our current lead volume imply for pipeline in Q2 or Q3, and is our current spend sufficient to hit the pipeline targets set for those quarters?”
Second, forecasting accuracy degrades as you extend the time horizon. A 30-day pipeline forecast built on current SQL volumes is far more reliable than a 90-day forecast built on current lead volumes. The further back in the funnel you are projecting from, the more conversion rate assumptions you are stacking on top of each other, and the wider your confidence interval needs to be.
When presenting forecasts to leadership, present ranges rather than single-point estimates, and be explicit about what stage of the funnel the forecast is built from. A forecast from current SQLs is materially more reliable than one built from top-of-funnel lead volumes.
.jpeg)
Multi-Platform Reporting and the Data Integrity Challenge
One of the most common frustrations for marketing ops in B2B SaaS is that the numbers in Google Ads, LinkedIn Campaign Manager, HubSpot, and Salesforce rarely agree with each other. This is not a quirk to be ignored. It directly undermines forecasting reliability.
The attribution discrepancies come from several sources: platform-level attribution models that claim credit for the same conversion, different conversion window settings, cookie deprecation affecting pixel-based tracking, and CRM data entry lag when sales reps do not log activities promptly.
For pipeline forecasting specifically, the number you should be building your model on is the CRM number, not the platform number. The CRM is the system of record for pipeline. If your CRM shows 40 SQLs attributed to paid search in the last 30 days, that is the figure you use, regardless of what Google Ads reports as conversions. Platform attribution is useful for optimisation decisions within the platform. CRM data is what you report to leadership.
That means your forecasting accuracy is only as good as your CRM hygiene. If leads from paid campaigns are not being tagged with source data correctly, or if the lead-to-contact-to-opportunity creation workflow is inconsistent, your model will produce unreliable outputs no matter how sophisticated the forecasting logic is.
A practical first step is a data integrity audit before building or presenting any forecast: check UTM tagging consistency, CRM source attribution, and whether stage transition dates are being captured accurately. This is not glamorous work, but it is the difference between a forecast you can defend and one that falls apart under questioning.
The topic of multi-touch attribution modelling across long B2B sales cycles is a significant one in its own right, and something we explore in depth through our saas analytics resources.
.jpeg)
What PPC Forecasting Cannot Reliably Tell You
Being clear about limitations is part of what makes a forecast credible. Here is where the signal genuinely degrades.
Long-horizon pipeline from top-of-funnel PPC. If you are running awareness-stage or mid-funnel paid social campaigns, the pipeline contribution is real but it is multi-touch, long-lag, and difficult to isolate. You can model it directionally using influence attribution, but you cannot produce a defensible single-point forecast. Present it as a range with explicit uncertainty.
The effect of external market factors. Conversion rates in B2B SaaS are not stable across market conditions. Budget freezes, a shift in the competitive landscape, or a change in your ICP’s buying behaviour can shift your conversion rates significantly. Historical averages may not hold in a changed environment.
What happens after the lead is generated. If the pipeline is not materialising from what looks like adequate lead volume, the problem is often downstream: qualification criteria, sales follow-up speed, or demo quality. PPC forecasting models assume a consistent sales process. If the sales process is variable, the model’s outputs will be inconsistent too.
The impact of brand spend on lead quality. Brand PPC typically generates higher conversion rates than non-brand. If your brand search volume increases (because of an event, PR, or organic growth), your overall conversion rates will improve. If it decreases, they will drop. Forecasting models that do not separate brand and non-brand traffic will misattribute the cause of rate changes.
Building a Forecasting Approach That Holds Up in Leadership Discussions
A defensible PPC pipeline forecast has four components.
A segmented lead model. Break your lead volume by intent bucket and campaign type. Do not blend rates across segments.
Stage-by-stage conversion rates with a stated confidence level. Use at least three months of data. Flag if the data is thin or if recent changes make historical rates unreliable.
A time-lag adjustment by sales cycle stage. Know how far back in the funnel you are forecasting from, and adjust your timeline accordingly. A forecast from SQLs covers the next 30 to 60 days. A forecast from raw leads covers the next 60 to 120 days depending on your cycle.
A range, not a single number. Present a low, mid, and high scenario based on conversion rate sensitivity. A 20% swing in lead-to-SQL rate is not unusual quarter to quarter. Showing how that affects pipeline output demonstrates analytical credibility rather than false precision.
When presenting this to a CMO or CFO, the narrative is straightforward: here is what the current lead volume implies for pipeline at historical conversion rates, here is the range based on conversion rate variability, and here are the assumptions that could shift the outcome. That is a much stronger position than a single number with no stated assumptions.
Frequently Asked Questions
What is the time frame for sales forecasts in B2B SaaS, and how far ahead can businesses predict pipeline performance?
A reliable forecast horizon depends on where in the funnel you are forecasting from. If you are forecasting from current SQLs, 30 to 60 days ahead is reasonably reliable. If you are forecasting from top-of-funnel lead volumes, you are looking at 60 to 180 days depending on your average sales cycle. Beyond six months, too many variables compound for any single-path forecast to hold up. Present longer-horizon forecasts as directional ranges with clearly stated assumptions rather than point estimates.
How do companies in the B2B SaaS sector effectively predict future sales based on PPC efforts?
The most reliable approach uses intent-segmented lead volumes combined with stage-by-stage CRM conversion rates. Rather than applying a single lead-to-close rate, companies that forecast well track conversion rates at each funnel stage separately and use three to six months of historical data to establish a stable baseline. They also separate brand and non-brand PPC traffic, which convert at significantly different rates.
What methodologies can B2B SaaS marketing ops leaders use to enhance measurement reliability in forecasting?
The most impactful steps are: consistent UTM tagging to ensure paid traffic is correctly attributed in the CRM, clean stage definitions in the CRM so conversion rates are measured against the same criteria over time, and separating traffic by intent bucket before calculating conversion rates. Data integrity work upstream of the model is what determines forecast reliability more than the sophistication of the forecasting logic itself.
How can intent buckets be utilised to improve the accuracy of sales forecasts derived from PPC?
By segmenting PPC traffic into high-intent (demo requests, branded terms), mid-intent (category searches, feature queries), and low-intent (awareness, retargeting) groups, you apply separate conversion rate models to each. High-intent traffic converts faster and at higher rates, so forecasts built on that segment are more reliable. Blending all PPC traffic into a single conversion rate typically produces a number that is too optimistic for low-intent volume and too pessimistic for high-intent volume.
What are the common challenges faced in multi-platform reporting for PPC in B2B SaaS, and how can they be addressed?
The main challenge is attribution discrepancy: platform-reported conversions do not match CRM data because platforms apply their own attribution windows and models. The resolution is to use CRM data as the single source of truth for pipeline forecasts and treat platform-level data as an optimisation signal rather than a reporting metric. This requires consistent UTM parameters, reliable lead source capture in the CRM, and a clear agreement with sales on how source attribution is recorded.
How do conversion rates impact the forecasting of pipeline performance in B2B SaaS?
Conversion rates are the primary lever in any pipeline forecast. A 20% change in lead-to-SQL conversion rate will produce a 20% change in forecasted pipeline from the same lead volume. This is why presenting forecasts as ranges rather than single numbers matters. If your model uses a 5% lead-to-SQL rate and the actual rate comes in at 4%, the pipeline shortfall is predictable. Showing leadership the range scenario builds credibility and sets appropriate expectations.
What role does data integrity play in the accuracy of sales forecasts in B2B SaaS marketing?
It is foundational. A forecast built on inconsistently tagged leads, variable stage definitions, or incomplete CRM records will produce unreliable outputs regardless of how sophisticated the forecasting logic is. Data integrity problems compound at each stage of the model. Before building or presenting forecasts, a quick audit of UTM consistency, source attribution, and stage transition data in the CRM is the highest-value step most teams skip.
How can sales cycle stages be factored into forecasting pipeline performance from PPC?
Map out the average time spent at each stage from first touch through to closed-won, then use that to determine the time lag between current lead volumes and expected pipeline entry. If your average time from MQL to SQL is 14 days and SQL to Opportunity is another 21 days, a lead generated today is unlikely to show up as pipeline for five to six weeks. Build that lag into any forecast you present, particularly when leadership is asking about near-term pipeline contribution from current PPC activity.
What actionable insights can B2B SaaS marketing operations specialists derive from PPC data for forecasting?
The most valuable PPC signal for forecasting is the ratio of high-intent to low-intent lead volume over time, combined with stage-by-stage conversion rate trends. If high-intent volume is growing and conversion rates are stable, pipeline should follow. If lead volume is growing but conversion rates are declining, the quality of traffic is shifting and the forecast needs to be revised downward. Tracking these signals week over week gives you early warning before pipeline shortfalls show up in the CRM.
How can B2B SaaS companies justify their forecasting strategies and decisions to stakeholders?
Present the model, not just the number. Showing stakeholders the inputs (lead volume by intent bucket, conversion rates with stated data windows, sales cycle assumptions, and scenario ranges) creates a defensible forecast because it separates what you are controlling from what you are assuming. When the forecast is off, you can explain which assumption shifted. That positions marketing ops as analytical and credible, rather than simply wrong.
If you are working through pipeline forecasting challenges and want a second perspective on your measurement setup, we are happy to take a look. This is the kind of problem we work through with B2B SaaS teams regularly.