When CAC Spikes: The 7 Most Common Failure Modes in Series A+ SaaS PPC Accounts
Learn the 7 most common failure modes behind CAC spikes in Series A+ SaaS PPC accounts, from signal drift to intent dilution and saturation.

Why CAC Spikes Are Different in Series A+ Accounts
CAC is a blended metric. It combines the cost of generating traffic, converting that traffic into leads, qualifying those leads into pipeline, and closing that pipeline into customers. A spike in CAC can originate at any of these stages, and attributing it to the wrong stage produces fixes that are ineffective at best and actively harmful at worst.
Series A+ accounts have a specific challenge that earlier-stage accounts do not: they have enough spend history that Smart Bidding has formed strong patterns, enough conversion volume that small changes produce visible effects, and enough stakeholder pressure that the instinct to react quickly is strong. This combination produces the most common failure mode of all, which is not in the seven below: making multiple simultaneous changes in response to a CAC spike, introducing new variables that make the real cause harder to identify, and then concluding that the situation is complex when it was actually fixable with a single targeted intervention.
Benchmarkit’s 2025 SaaS Performance Metrics data shows the median new CAC ratio rose 14% in 2024 to £2 of sales and marketing expense per £1 of new ARR, with fourth-quartile companies spending £2.82. That market-level pressure is real, but it does not explain a sudden spike in a previously stable account. Sudden spikes are almost always account-level events, not market-level ones. The seven failure modes below are what those events look like.
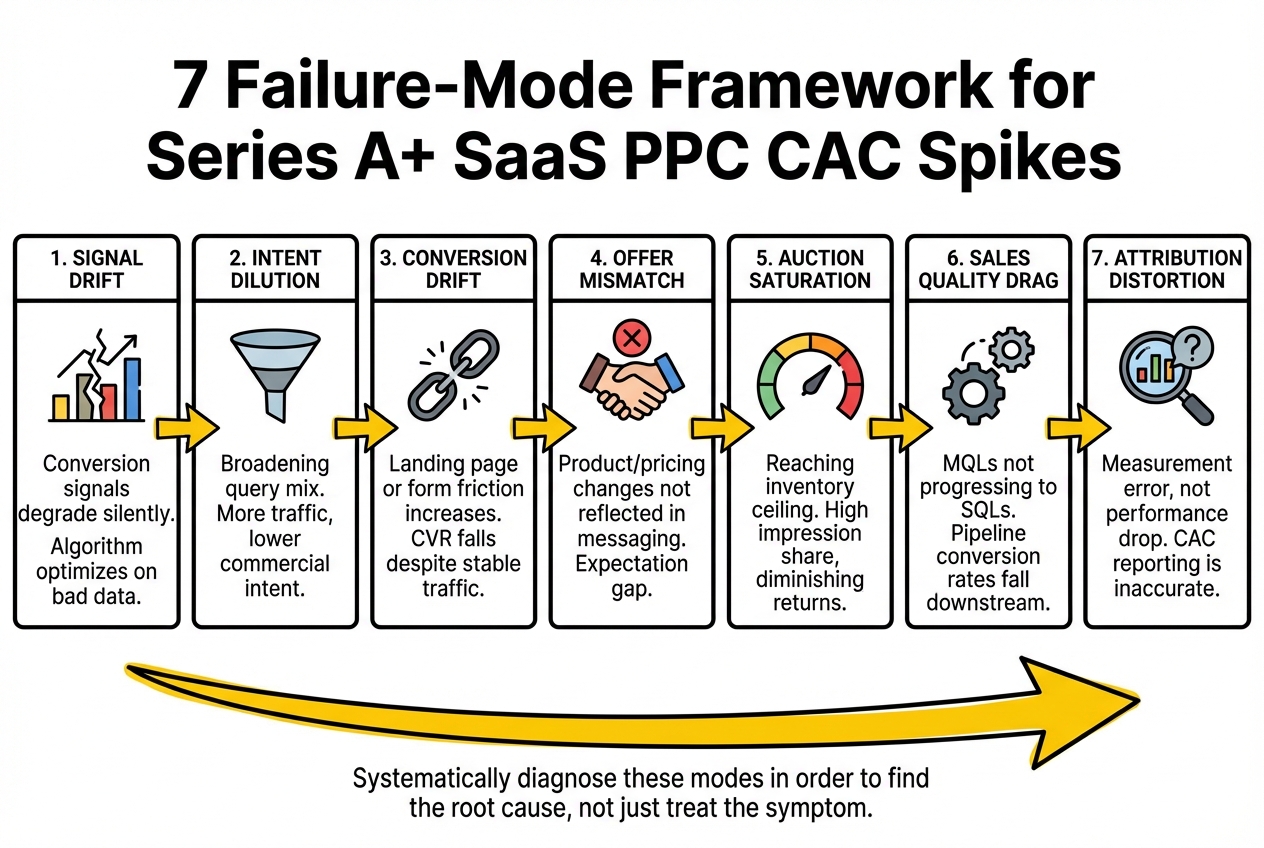
Failure Mode 1: Signal Drift
What it is: The conversion signals feeding Smart Bidding have shifted in quality or composition without any deliberate change. The algorithm is still optimising toward the same conversion events, but those events no longer represent the same commercial value they did when the bidding strategy was set up.
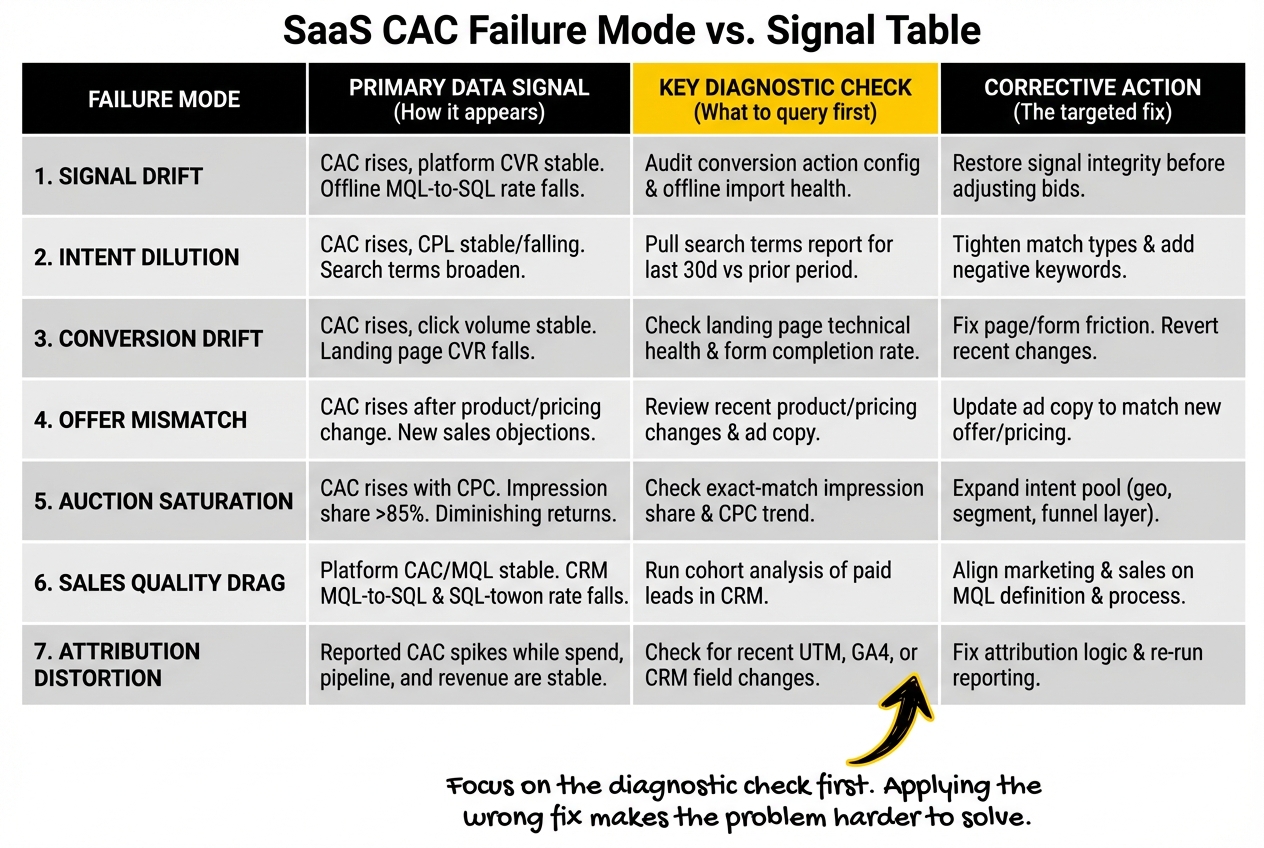
How it appears in the data: CAC rises while platform-reported conversion volume is stable or slightly down. The MQL-to-SQL rate from paid leads falls. Sales begins reporting lower-quality demos. The change is gradual rather than sudden, typically appearing over four to eight weeks.
Common causes: Offline conversion imports stopped or degraded without being noticed. A form was changed that altered what the conversion event represents. A new campaign was launched that imports a different conversion type into the same Smart Bidding pool. The algorithm was retrained on a mixed signal and is now bidding toward a blended audience that includes lower-intent buyers.
Correct response: Audit the conversion action configuration in Google Ads. Check offline conversion import health in the Diagnostics tab. Compare platform conversion volume against CRM intake for the same period. If a divergence has opened, restore the signal before adjusting any bids.
Failure Mode 2: Intent Dilution
What it is: The account is generating more conversions from lower-intent queries. The volume numbers look reasonable. The quality of what is converting has deteriorated.
How it appears in the data: CAC rises while cost-per-lead is stable or even falling. Lead volume is up or flat. The search terms report shows a broadening query mix: more informational queries, more tangentially related terms, fewer exact-intent commercial searches. MQL rate falls. Sales reports a higher proportion of unqualified leads.
Common causes: A shift to broad match keywords without corresponding Smart Bidding signal quality. Budget increases that pushed Smart Bidding to expand reach beyond the high-intent inventory. A match type change that widened the query pool. Performance Max absorbing high-intent traffic while serving the remaining budget against broader queries.
Correct response: Pull the search terms report for the last 30 days and compare it to the equivalent period before the CAC spike. If the query mix has broadened materially, tighten match types or add negative keywords targeting the lowest-intent clusters. Do not reduce overall budget until the query mix is corrected.
Failure Mode 3: Conversion Drift
What it is: The conversion rate on landing pages or in the post-click journey has declined, increasing the number of clicks required to generate each lead and therefore increasing cost-per-lead and CAC.
How it appears in the data: Click volume is stable or rising. Cost-per-click is roughly stable. Cost-per-conversion rises because fewer clicks convert. Landing page session data shows a rising bounce rate or declining time on page. Form completion rate has fallen.
Common causes: A landing page update, redirect, or CMS change that broke something in the conversion flow. A form that became harder to complete on mobile after a template change. A CTA or offer that was altered without the paid traffic being aware. Slow page load speed introduced by a new tracking script or third-party embed.
Correct response: Run a technical check on landing pages. Confirm the form submits correctly on desktop and mobile. Check page load time against the baseline from two months prior. Compare form completion rate before and after the spike began. This failure mode is usually fixable within days once identified.
Failure Mode 4: Offer Mismatch
What it is: The product or offer that paid traffic is being sent to has changed, or the market’s response to that offer has shifted, and the landing page is no longer converting at the rate the account was built around.
How it appears in the data: CAC rises after a product update, pricing change, or new positioning launch. Conversion rate falls on the same landing pages that previously performed well. Sales reports objections or confusion that were not present before. Qualitative feedback from sales calls surfaces new hesitations.
Common causes: A pricing increase not reflected in ad copy that creates expectation mismatch. A product pivot or new feature emphasis that the landing page does not yet reflect. Competitive pressure from a new entrant that has changed the buyer’s reference frame. A trial-to-paid change that altered the perceived value of the demo or free trial offer.
Correct response: Review what has changed in the product, pricing, or positioning in the four to eight weeks before the spike. Check ad copy against landing page messaging for consistency. Interview two or three recent sales prospects who did not convert. This failure mode requires a product marketing response, not a PPC response, but the PPC team needs to surface it.
Failure Mode 5: Auction Saturation
What it is: The account has reached the ceiling of commercially valuable intent inventory for the target segment. Additional spend is competing for lower-quality queries and traffic that was always there but not previously worth buying.
How it appears in the data: CAC rises alongside rising CPCs on core terms. Impression share on exact-match category terms approaches 85-90%. Incremental budget increases produce diminishing returns on conversion volume. Lead quality deteriorates as volume increases. The pattern is gradual and accelerates as spend pushes further into the available inventory.
Common causes: Budget has scaled beyond what the addressable intent pool supports. A spend increase was made without saturation signals being monitored. Geographic or segment expansion was not undertaken to extend the ceiling before pushing more budget into the existing pool.
Correct response: Check top-of-page impression share on core exact-match terms. If it is above 85%, additional budget in the same segment will produce diminishing returns. The fix is not to reduce spend but to expand the intent pool: new geographies, adjacent ICP segments, or lower-funnel retargeting. The budget allocation article in this series covers the expansion paths in detail.
Failure Mode 6: Sales Quality Drag
What it is: PPC is generating leads that meet the MQL threshold, but sales is not accepting or progressing them at the rate that was used to calibrate the account’s CAC model. The marketing-reported CAC looks manageable. The true cost-per-closed-won customer has spiked because the MQL-to-SQL and SQL-to-closed rate has fallen.
How it appears in the data: Platform CAC and marketing-reported cost-per-MQL are stable. CRM-reported cost-per-opportunity and cost-per-closed-won have risen sharply. Sales cycle length has extended. Win rate has fallen. The disconnect between platform metrics and CRM metrics is the defining signal.
Common causes: ICP drift: the account is attracting a different buyer profile than it was calibrated for, perhaps after a product repositioning or a geographic expansion. A change in sales capacity or process that reduced the team’s ability to progress leads that previously converted. Misalignment between marketing’s MQL definition and what sales considers worth pursuing, which has widened over time.
Correct response: This failure mode requires a conversation between marketing and sales, not a PPC change. Run a cohort analysis of paid leads from the last 90 days: what percentage became SQLs? What percentage closed? Compare to the same metrics from six months ago. If the pipeline conversion rates have fallen without a corresponding change in lead volume or lead source, the problem is downstream of paid. Fixing the PPC account will not address it. Structuring SaaS PPC Accounts for PLG vs Sales-Led Funnels, also on this blog, takes this further.
Failure Mode 7: Attribution Distortion
What it is: CAC has not actually spiked. The measurement of CAC has become less accurate, producing a reported figure that is worse than reality. The account is performing at a similar level to before, but a change in attribution configuration, CRM data quality, or reporting methodology has made it look worse.
How it appears in the data: Reported CAC spikes while other commercial signals (pipeline volume, close rate, revenue) remain stable. A change to the attribution model, CRM configuration, or reporting pipeline occurred around the same time as the apparent spike. Platform-reported metrics and CRM-reported metrics are diverging in different directions from their usual relationship.
Common causes: A UTM naming convention change that broke source attribution, causing paid leads to appear as direct or organic in the CRM. A GA4 configuration change that altered how paid sessions are tracked. A CRM field update that reclassified existing leads, distorting the historical comparison. An offline conversion import that was paused and then restarted, creating a gap in the reported data that inflates apparent CAC during the gap period.
Correct response: Before investigating any of the other six failure modes, check whether the spike is real by triangulating across data sources. Platform spend is a fact. CRM lead intake is a fact. Reported CAC is a calculation based on those facts plus the attribution logic connecting them. If spend is stable and pipeline is stable but reported CAC has spiked, the attribution layer is where to look first.
The Diagnosis Order
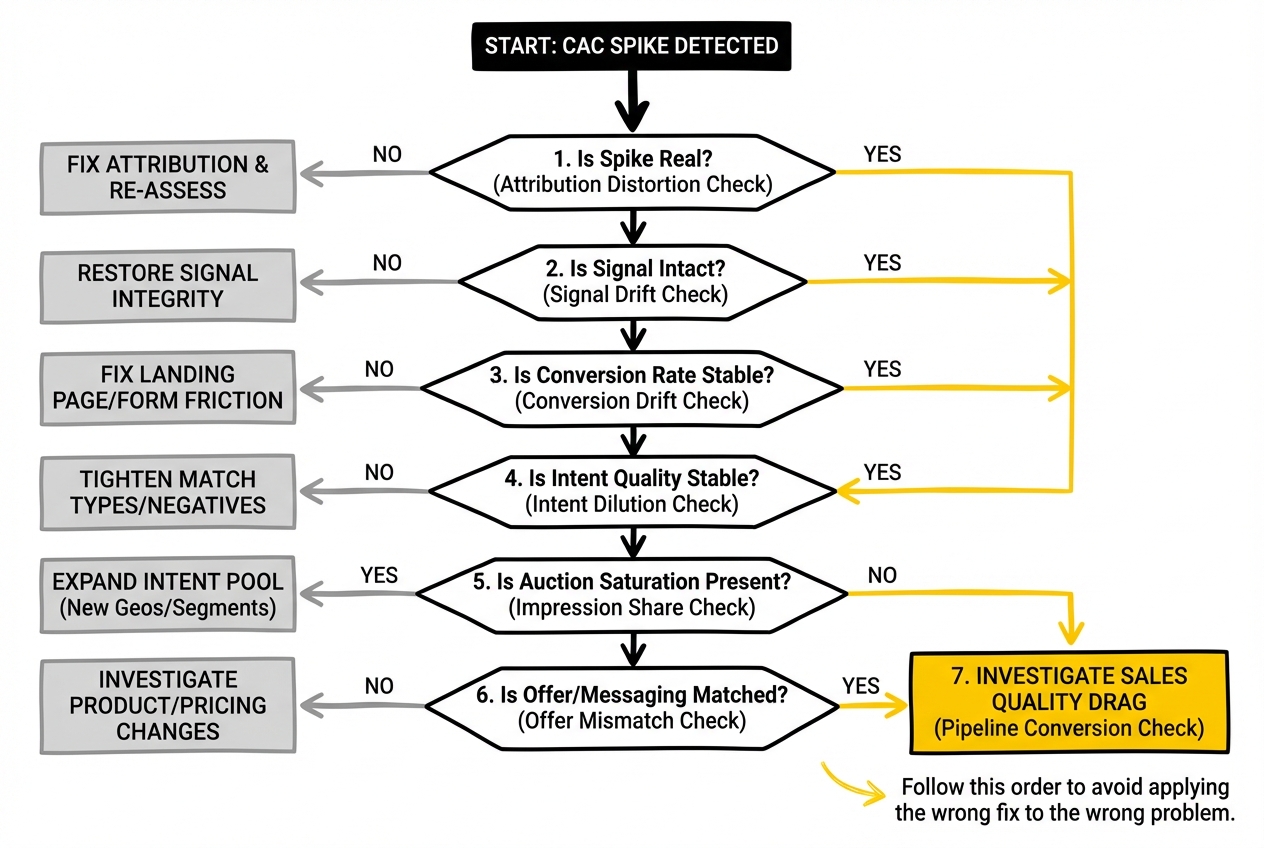
CAC spikes are often multi-causal, meaning two or three failure modes are operating simultaneously. The order in which to investigate them matters because some are faster to rule out than others, and because fixing one may reveal another that was masked.
Start with attribution distortion: confirm the spike is real before investigating causes. Then check signal drift, because a broken or degraded signal corrupts the other failure modes. Then check conversion drift, because it is the most operationally fixable and the most likely to have a clear trigger. Then check intent dilution through the search terms report. Then assess auction saturation. Then check offer mismatch. Sales quality drag is last because it requires cross-functional input and typically takes the longest to diagnose accurately.
When two or more failure modes are present simultaneously, fix them in this order as well: signal integrity first, then conversion mechanics, then intent quality. Trying to address offer mismatch or saturation when the signal is broken produces unreliable results because the algorithm’s response to any change will be distorted by the underlying data quality problem.
Our SaaS PPC agency runs this failure mode analysis as a standard part of account reviews for Series A+ SaaS teams. If CAC has spiked and the cause is not obvious, working through the seven modes in order is the fastest path to a specific, fixable diagnosis. The next step after diagnosis is stabilisation: the account turnaround without losing pipeline article covers the execution plan for accounts where multiple failure modes are active simultaneously.
Frequently Asked Questions
Why does CAC suddenly spike in a Series A+ SaaS PPC account?
The seven most common causes are: signal drift (conversion signals degraded without deliberate change), intent dilution (query mix broadened to lower-intent traffic), conversion drift (landing page or form conversion rate declined), offer mismatch (product or pricing changed and the page no longer converts), auction saturation (the intent pool is exhausted and additional spend buys lower-quality traffic), sales quality drag (marketing CAC is stable but pipeline conversion rates have fallen), and attribution distortion (CAC reporting has become less accurate without actual performance changing). Most spikes involve two or three of these operating simultaneously.
What are the most common failure modes behind rising SaaS PPC CAC?
Signal drift and intent dilution are the most frequently encountered, because both occur silently without any deliberate account change. Signal drift happens when offline conversion imports degrade or conversion action configurations drift from their original intent. Intent dilution happens when Smart Bidding or broad match gradually expands the query mix beyond the high-intent inventory. Both produce rising CAC with stable or even improved platform-native metrics, which is why they are commonly missed.
How do you tell whether a CAC spike is caused by traffic quality or conversion drift?
Traffic quality (intent dilution) shows up as stable or falling CPCs with rising MQL cost and declining MQL-to-SQL rate. The search terms report will show a broadening query mix. Conversion drift shows up as stable click volume and CPCs with a falling conversion rate on the landing page. Bounce rate rises and form completion falls. The platform reports fewer conversions despite similar traffic. The simplest initial test: if cost-per-click is stable and conversion rate has fallen, the problem is on the page. If conversion rate is stable but lead quality has declined, the problem is in the query mix.
Can bad attribution make CAC look worse than it really is?
Yes, and it is one of the most common causes of apparent CAC spikes that resolve themselves once attribution is corrected. A UTM naming convention change that breaks source attribution in the CRM, a GA4 configuration update, or a CRM field reclassification can all inflate reported CAC without any change in actual performance. The diagnostic test: check whether platform spend is stable, pipeline volume is stable, and revenue is stable. If all three are, the CAC spike is most likely a reporting problem rather than a performance one.
Which failure mode should SaaS teams check first when CAC rises fast?
Attribution distortion, because it is the fastest to confirm or rule out and determines whether the spike is real. If attribution is intact and the spike is confirmed, check signal drift next, because broken signals corrupt the account’s ability to respond correctly to any subsequent fix. Signal integrity is the foundation everything else depends on.
When does a CAC spike mean the account is saturating?
When top-of-page impression share on core exact-match category terms is above 85%, CPCs are rising without corresponding quality improvements, and incremental budget increases are producing diminishing pipeline returns. Saturation appears gradually, not suddenly, which distinguishes it from signal drift or conversion drift. If CAC has been rising slowly over two to three months rather than spiking in a two-week window, saturation is more likely than the other failure modes.
How does poor sales acceptance affect CAC diagnosis?
Sales quality drag creates a disconnect between marketing-reported CAC and actual cost-per-closed-won customer. If marketing is measuring CAC at the MQL level and sales acceptance rates or pipeline conversion rates have fallen, the board-level CAC number will be worse than the marketing dashboard shows. This failure mode does not require a PPC fix. It requires a diagnosis of what changed in the sales motion, the ICP qualification, or the product-market fit for the buyer profile the campaigns are attracting.
What should a SaaS team fix first after a CAC spike?
Confirm attribution accuracy, then restore signal integrity, then address conversion mechanics. Only after those three are clean should the team investigate offer mismatch, intent dilution, saturation, or sales quality drag. Fixing downstream problems while the signal is broken produces unreliable results. Fixing attribution while the form is broken produces the right diagnosis but the wrong fix. The sequence matters as much as identifying the correct failure mode.
If CAC has spiked and the first response is to cut spend, you are probably about to make it worse. Work through the failure modes in order, identify the specific cause, and apply the targeted fix. Most CAC spikes in Series A+ SaaS accounts have a findable cause and a fixable solution. The hard part is resisting the pressure to act before the diagnosis is complete.