Budget Allocation for Demand Capture: Scaling Without Inflating CPCs and CAC
Learn how to scale demand-capture budget in SaaS PPC without inflating CPCs and CAC, using better saturation and allocation signals.

What Demand Capture Budget Allocation Actually Means
Demand capture in SaaS PPC targets buyers who are already in the market: people actively searching for the product category, evaluating specific vendors, or showing high-intent signals. The budget allocation question is not whether to run capture campaigns, it is how much to put into them, and when adding more stops producing proportional returns.
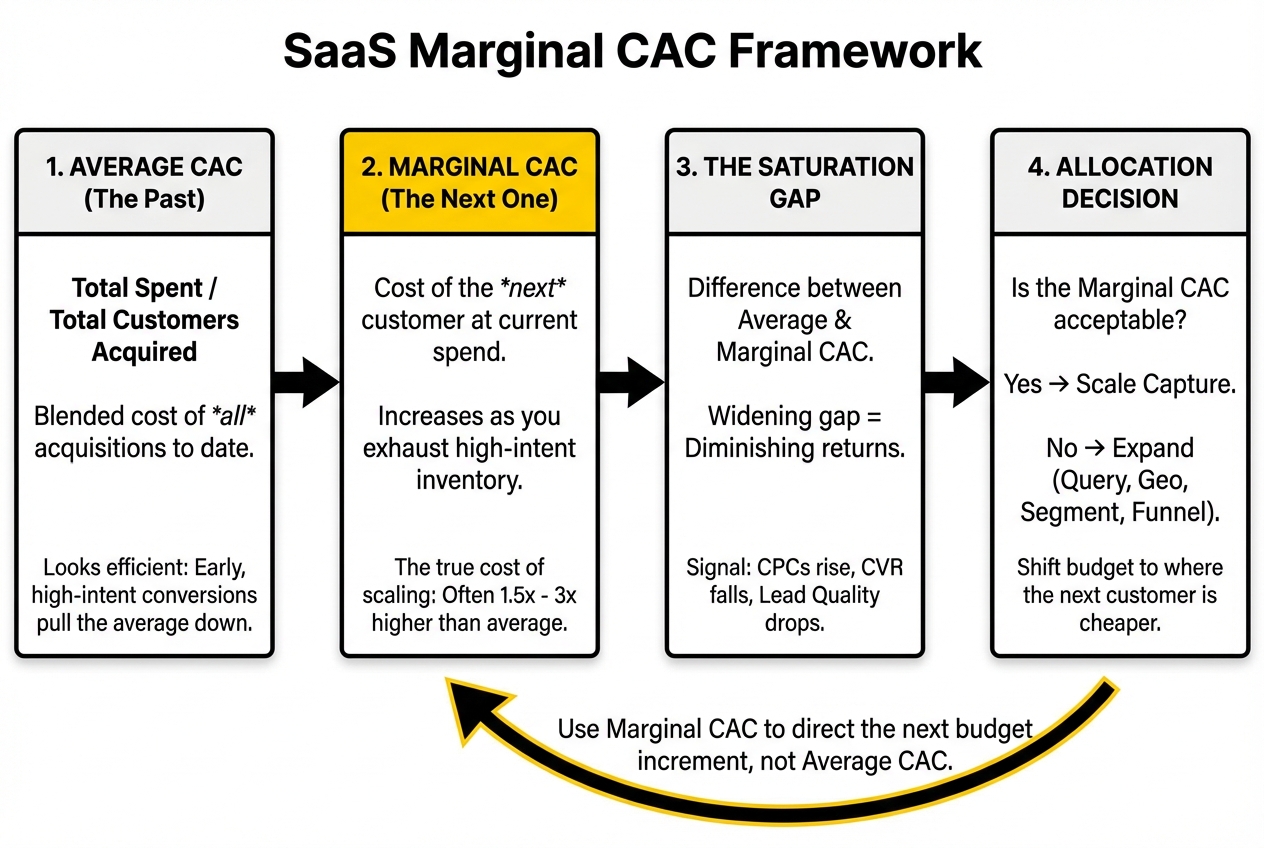
Most SaaS teams frame this as a channel budget question. It is actually a marginal economics question. The relevant number is not what your average CAC is today. It is what acquiring one more customer via capture would cost if you increased spend by 20%. That marginal cost is almost always higher than the average, and in saturating channels, it can be significantly higher.
The distinction matters because scaling decisions based on average CAC typically look more favourable than they actually are. A campaign running at a £120 average cost-per-opportunity might be generating its first 50 opportunities at £80 and its next 20 at £200. The average looks fine. The marginal economics of further scaling do not.
How Saturation Shows Up Before You Notice It
Capture saturation does not announce itself cleanly. It appears as a cluster of signals, each of which is explainable on its own, and which together indicate the same thing: the account is approaching the ceiling of the addressable intent pool.
Rising CPCs without bid changes. If CPCs are increasing on core category terms and you have not changed bids or match types, competitive pressure in the auction has increased. This is normal at smaller scale. When it accelerates across multiple campaigns simultaneously, it is a saturation signal.
Impression share plateau. When top-of-page impression share on your core terms approaches 85-90% and further budget increases produce minimal impression share gains, you have captured the addressable inventory. More budget does not buy proportionally more reach because the reach is no longer there to buy.
Declining query quality. As Smart Bidding optimises for volume at higher spend levels, the search terms triggering your ads broaden. Lead quality degrades not because targeting changed, but because the algorithm is finding the next-best matches after the highest-intent pool is saturated. This shows up in CRM as a rising MQL volume alongside a falling MQL-to-SQL rate.
Flat or declining conversion rate at rising spend. A capture campaign that converts at 4.5% at £15k/month and 3.1% at £35k/month is not underperforming. It is accurately reflecting that the additional traffic it is buying is lower-intent than the traffic it was buying before.
Cost-per-opportunity diverging from cost-per-lead. Average CPA from the platform looks acceptable. But when you join platform spend to CRM pipeline data, cost-per-opportunity and cost-per-SQL are increasing faster than cost-per-lead. The leads are still coming. The qualified ones are getting more expensive.
Monitoring these five signals weekly is the most reliable way to detect saturation before it shows up as a budget problem in a board report. Benchmarkit’s 2025 SaaS Performance Metrics data shows the median new CAC ratio rose 14% in 2024 to £2 of sales and marketing expense per £1 of new ARR, a trajectory that reflects the underlying pressure on digital capture channels across the market.

Why Average CAC Misleads Scaling Decisions
Average CAC is a backward-looking number. It describes the cost of acquiring the customers you have already acquired. It tells you nothing about the cost of the next one.
In a well-structured capture account, the first tranche of spend targets the highest-intent, most commercially qualified searches. These are the queries where the buyer is furthest along the funnel, the match is tightest, and the conversion rate is highest. They are also the cheapest to convert on a cost-per-opportunity basis.
As spend scales, the account moves into progressively lower-intent territory: broader match types, adjacent queries, lookalike audiences, and extended geographic coverage. Each expansion reduces the average intent level of the traffic. The platform reports a rising cost-per-click and the CRM reports a falling close rate. Average CAC rises, and then rises faster.
The practical implication: if your capture account is currently generating 30 qualified opportunities per month at an average cost-per-opportunity of £800, and your board asks what doubling the budget would produce, the answer is not 60 opportunities at £800 each. It might be 40 opportunities at £1,200 each. Whether that marginal cost is acceptable depends on ACV and CAC payback targets, not on the historical average.
Framing scaling decisions around marginal CAC rather than average CAC produces better decisions. It also surfaces the right question: is there a better expansion path than pushing more budget into the current intent pool?
The Four Expansion Paths
When capture campaigns approach saturation in a given segment, there are four ways to expand the ceiling rather than push against it. Each has a different risk profile and a different time horizon to return.
1. Query layer expansion. The first expansion is typically within the same intent segment, moving from exact and phrase match on core terms into the long-tail query clusters that sit adjacent to them. A capture account targeting "project management software for SaaS" might expand into "PM tool with Jira integration" or "project tracking for remote engineering teams." These queries have lower individual volume but often convert at comparable or higher rates because the intent is specific. Search query mining is the tool for finding them: the queries already triggering your campaigns are often the clearest signal of where to expand. The work on search query mining for B2B SaaS covers that workflow in detail.
2. Geographic expansion. If a capture account is performing well in primary markets and those markets are approaching saturation, secondary geographies with similar ICP density are the next logical pool. This works well for SaaS teams with a clear mid-market ICP in multiple English-speaking markets, where the product and messaging require minimal adaptation. The risk is that secondary markets may have lower intent density than primary ones, which means initial CPAs will look worse before the algorithm optimises.
3. Segment expansion. A capture account targeting one ICP segment can expand to adjacent ones where the product also serves a need. A collaboration tool for engineering teams might expand capture campaigns targeting product and design teams with adjusted messaging and landing pages. Each new segment effectively creates a new intent pool rather than competing for inventory in the existing one. Segment expansion is the highest-effort path but often produces the best marginal economics because it is genuinely additive rather than competitive.
4. Funnel layer expansion. When bottom-of-funnel capture is saturating, pushing budget toward mid-funnel terms, retargeting, and intent-based audiences can extend reach without inflating CPCs on the highest-intent queries. This is not demand generation; it is a capture campaign operating higher in the funnel, targeting buyers who are in the category but not yet at the point of active vendor evaluation. The conversion rates are lower, the sales cycles are longer, and the attribution requires CRM data to see clearly, but the incremental pipeline it produces is real and often less expensive than competing for the same high-intent queries at scale.
.jpeg)
How Capture Budget Interacts with Brand and Competitor Spend
One of the most common mistakes in capture scaling is treating all paid budget as a single pool. In practice, brand, competitor, and category capture keywords have very different economic profiles, and scaling one without a view across all three produces misallocated spend.
Brand keywords should be protected before category capture is scaled. Brand queries carry the highest intent in the account and the lowest CPCs. Losing brand impression share to competitors or review aggregators while simultaneously pushing more budget into category capture is an inefficient trade: you are overpaying for lower-intent traffic while giving away the highest-intent traffic for free. Brand defence is the floor, not an afterthought.
Competitor keywords carry higher CPCs than category terms but often produce qualified pipeline faster, because the prospect is already comparing. The marginal economics of competitor capture depend on whether your product has a defensible differentiator against the specific competitor you are targeting. Adding competitor budget when category terms are saturating can make sense if the differentiator argument is clear. Adding it to absorb budget that has nowhere productive to go is waste in a different costume.
Category terms are the core capture engine. They are also the first to saturate. The right sequencing is to protect brand, ensure competitor campaigns are justified by a real switching argument, and then allocate remaining capture budget to category terms with a clear saturation monitoring process in place. How to Build a SaaS PPC Engine for B2B SaaS (Not Just Run Ads), also on this blog, takes this further.
The broader question of how to split budget between capture and demand generation is covered in the companion article on demand capture vs demand generation in B2B SaaS. The focus here is specifically on the allocation logic within the capture envelope.
When to Stop Scaling and What to Do Instead
The honest answer is that most capture accounts have a ceiling, and that ceiling is lower than most teams expect. The total volume of genuinely high-intent, in-market buyers for a specific SaaS product at any given time is not large. In many mid-market SaaS categories, it is in the hundreds of searches per month, not thousands.
When the four saturation signals are consistently present and the four expansion paths have been evaluated and either executed or ruled out, the right call is to hold capture spend at its current level and direct incremental budget elsewhere: demand generation, brand awareness, or retention-focused spend that extends LTV and reduces the pressure on new acquisition.
This is a commercially uncomfortable position to take, because it requires telling a growth-oriented board that more paid search spend will not produce proportionally more pipeline. The data from a well-instrumented account makes the argument. Cost-per-opportunity rising at a faster rate than cost-per-lead is visible in any CRM joined to platform spend data. Impression share plateaus are visible in Google Ads. Query quality shifts are visible in the search terms report.
The teams that scale capture budget most effectively are the ones that treat it as a resource with a ceiling, not a lever with unlimited upside. Scaling with discipline means knowing what the next pound of spend will actually produce, not assuming it will match what the last pound produced.
Our SaaS PPC agency works through this analysis regularly with SaaS teams who are at the point of scaling capture spend. If the economics of your current account are unclear, the marginal CAC calculation is usually the clearest place to start. For accounts where saturation has led to a broader performance decline, the PPC account turnaround playbook covers the structural rebuild that typically follows.
Frequently Asked Questions
How do you scale demand capture without inflating CAC?
Scale into new intent pools rather than pushing more budget into saturated ones. The four expansion paths are query layer expansion (long-tail adjacent terms), geographic expansion, segment expansion (adjacent ICP segments), and funnel layer expansion (mid-funnel and retargeting). Each creates additional inventory rather than competing for existing inventory. Monitor marginal CAC alongside average CAC to detect when further scaling within a given pool starts producing diminishing returns.
What signals show a SaaS capture campaign is saturating?
Five signals to watch: rising CPCs without bid changes, impression share plateauing above 85%, declining query quality in the search terms report, conversion rates falling as spend increases, and cost-per-opportunity rising faster than cost-per-lead. Any two of these together warrant a saturation review. All five together mean the intent pool for that segment is close to ceiling.
When should a SaaS team expand to new intent buckets instead of adding more budget?
When top-of-page impression share on core terms is above 85%, CPCs are rising without corresponding increases in lead quality, and the MQL-to-SQL rate from capture campaigns is declining. At that point, adding budget to existing campaigns inflates cost without adding proportional pipeline. Query layer, segment, or geographic expansion creates new intent pools with better marginal economics.
How does marginal CAC affect PPC budget decisions?
Marginal CAC is the cost of acquiring one additional customer given current spend levels. It is almost always higher than average CAC, because the highest-intent, easiest-to-convert searches are captured first. Scaling decisions based only on average CAC will consistently underestimate the true cost of the next increment of growth. A capture account with a £100 average cost-per-lead might have a marginal cost-per-lead of £160 at the next budget increment if the highest-intent queries are already saturated.
What is the difference between average CAC and marginal CAC in SaaS PPC?
Average CAC is the total acquisition cost divided by total customers acquired over a period. It reflects the blended cost of all spend, including the highly efficient early inventory and the less efficient incremental inventory. Marginal CAC is the cost of the next acquisition given current spend, which increases as the account moves into lower-intent query layers. The gap between average and marginal CAC widens as campaigns scale, which is why average CAC is a misleading input for scaling decisions.
How should branded, category, and competitor demand share budget?
Brand protection is the baseline and should be funded before category capture is scaled. Losing brand impression share while scaling category spend is an inefficient trade: you are overpaying for lower-intent traffic while handing away high-intent traffic. Competitor budget should be allocated only where a clear product differentiator exists against a specific competitor. Category terms are the core capture engine and receive the bulk of incremental budget, with saturation signals monitored continuously.
When do higher CPCs signal healthy expansion versus waste?
Higher CPCs signal healthy expansion when they are accompanied by stable or improving conversion rates, consistent query quality, and MQL-to-SQL rates that hold. They signal waste when conversion rates are falling, query quality is declining, and cost-per-opportunity is rising faster than cost-per-lead. The CPC number alone is not the signal. The relationship between CPC and downstream pipeline metrics is.
How do you know if demand capture is capped?
The clearest indicator is when impression share on exact-match core terms is consistently above 85-90% and additional budget increases produce minimal impression share gains. Combined with rising CPCs, declining conversion rates, and a rising MQL-to-SQL gap, this indicates the account has reached the ceiling of the addressable intent pool in the current segment. The response is expansion, not further investment in the same pool.
If your capture spend is producing flat pipeline at rising cost, the saturation signals are usually visible in the data before they surface in a board conversation. It is worth running the marginal CAC analysis before the next budget cycle.