Understanding CAC Payback Scenario Modelling for SaaS Paid Media Decisions
How conversion rates, ACV, win rates and sales cycle assumptions change CAC payback, and how to turn base, downside and upside scenarios into paid media decisions.

The board asks what happens to payback if you add £300k to paid search next year. You give them a number: 15 months. It’s precise, it’s defensible, and it’s almost certainly wrong, because it rests on five assumptions that will each drift before the money is spent.
CAC payback scenario analysis for SaaS paid media choices replaces that single number with a range. You set out which assumptions drive the result, how far each one could realistically move, and what decision you’d make at each end of the range. The output isn’t a forecast. It’s a decision framework that still holds when conversion rates dip or a quarter’s deals slip.
This article walks through CAC payback period modelling for SaaS from the inputs up. It includes a worked example, a sensitivity analysis, and how to turn scenarios into paid media guardrails and a board-ready narrative. If you need the fundamentals of the metric first, start with Mastering CAC, LTV, and Payback Period in B2B SaaS Marketing.
What CAC Payback Scenario Modelling Is
CAC payback scenario modelling is the practice of calculating CAC payback under several sets of assumptions, typically base, downside and upside. The goal is to understand the range of likely outcomes and which inputs drive it. It turns payback from a reported metric into a planning tool.
Most teams already calculate payback. Fewer model it. The difference matters because paid media decisions are made before the results exist. You commit budget in January against conversion rates, win rates and deal sizes you won’t see until autumn.
Benchmarks show how wide the realistic range is. Benchmarkit’s 2026 SaaS and AI Performance Benchmarks, based on 342 B2B SaaS and AI-native companies, put the 2025 median CAC payback at 16 months, with the top quartile at 6 months or fewer and the bottom quartile at 24. Two companies with similar spend can land at opposite ends of that spread because of a handful of funnel assumptions. Modelling tells you which ones are yours.
The Inputs That Drive SaaS Marketing Spend Payback Scenarios
For a paid media programme, CAC payback comes down to six inputs. Each sits at a different point in the funnel, and each is owned by a different team.
- Cost per click: what you pay for traffic. Owned by paid media.
- Conversion rate (click to demo): how much of that traffic becomes a demo request. Owned by paid media and web.
- Demo-to-SQO rate: how many demos become sales-qualified opportunities. Shared between marketing and sales.
- Win rate: how many SQOs close. Owned by sales.
- Average contract value and gross margin: how much each customer pays back per month. Owned by sales, product and finance.
- Sales cycle length: how long it takes for spend to turn into revenue. Mostly owned by sales.
The first four inputs set customer acquisition cost. The fifth sets how quickly that cost is recovered. The sixth doesn’t change the payback figure itself, but it changes when you’ll find out whether your assumptions were right, which matters just as much for planning.
Most paid media ROI analysis for SaaS focuses on the first two inputs, because those are the ones paid teams control. As the model below shows, they’re not the ones that move payback most.
Building the Model: A Worked Example
Building a CAC payback model takes five steps:
- Set base-case values for each input from your last four to six quarters of CRM data.
- Calculate cost per demo, cost per SQO and cost per customer at each funnel stage.
- Add sales cost per SQO to reach fully loaded CAC, then divide by monthly gross margin per customer.
- Flex each input up and down by a realistic margin, one at a time, to see which moves payback most.
- Combine the realistic worst and best cases into downside and upside scenarios.
Consider an illustrative Series B data platform running paid search for mid-market buyers. Its base-case inputs are a £18 cost per click, a 1.5% click-to-demo conversion rate, a 35% demo-to-SQO rate and an 18% win rate. ACV is £30,000 with 80% gross margin, so each customer returns £2,000 of gross margin per month. Sales cost works out at £2,160 per SQO.
Working down the funnel, each demo costs £1,200 in media and each SQO costs about £3,430. Media cost per customer is about £19,050, and sales cost adds £12,000. Fully loaded CAC is roughly £31,050, and payback is 15.5 months.
That’s the number most teams would take to the board. The useful work starts when you ask how fragile it is.
Sensitivity: Which Assumption Moves Payback Most
Flex each input by 20% in both directions, holding everything else constant, and the payback range for each looks like this:
- Win rate: 12.9 to 19.4 months.
- Average contract value: 12.9 to 19.4 months.
- Click-to-demo conversion rate: 13.9 to 17.9 months.
- Demo-to-SQO rate: 13.9 to 17.9 months.
- Cost per click: 13.6 to 17.4 months.
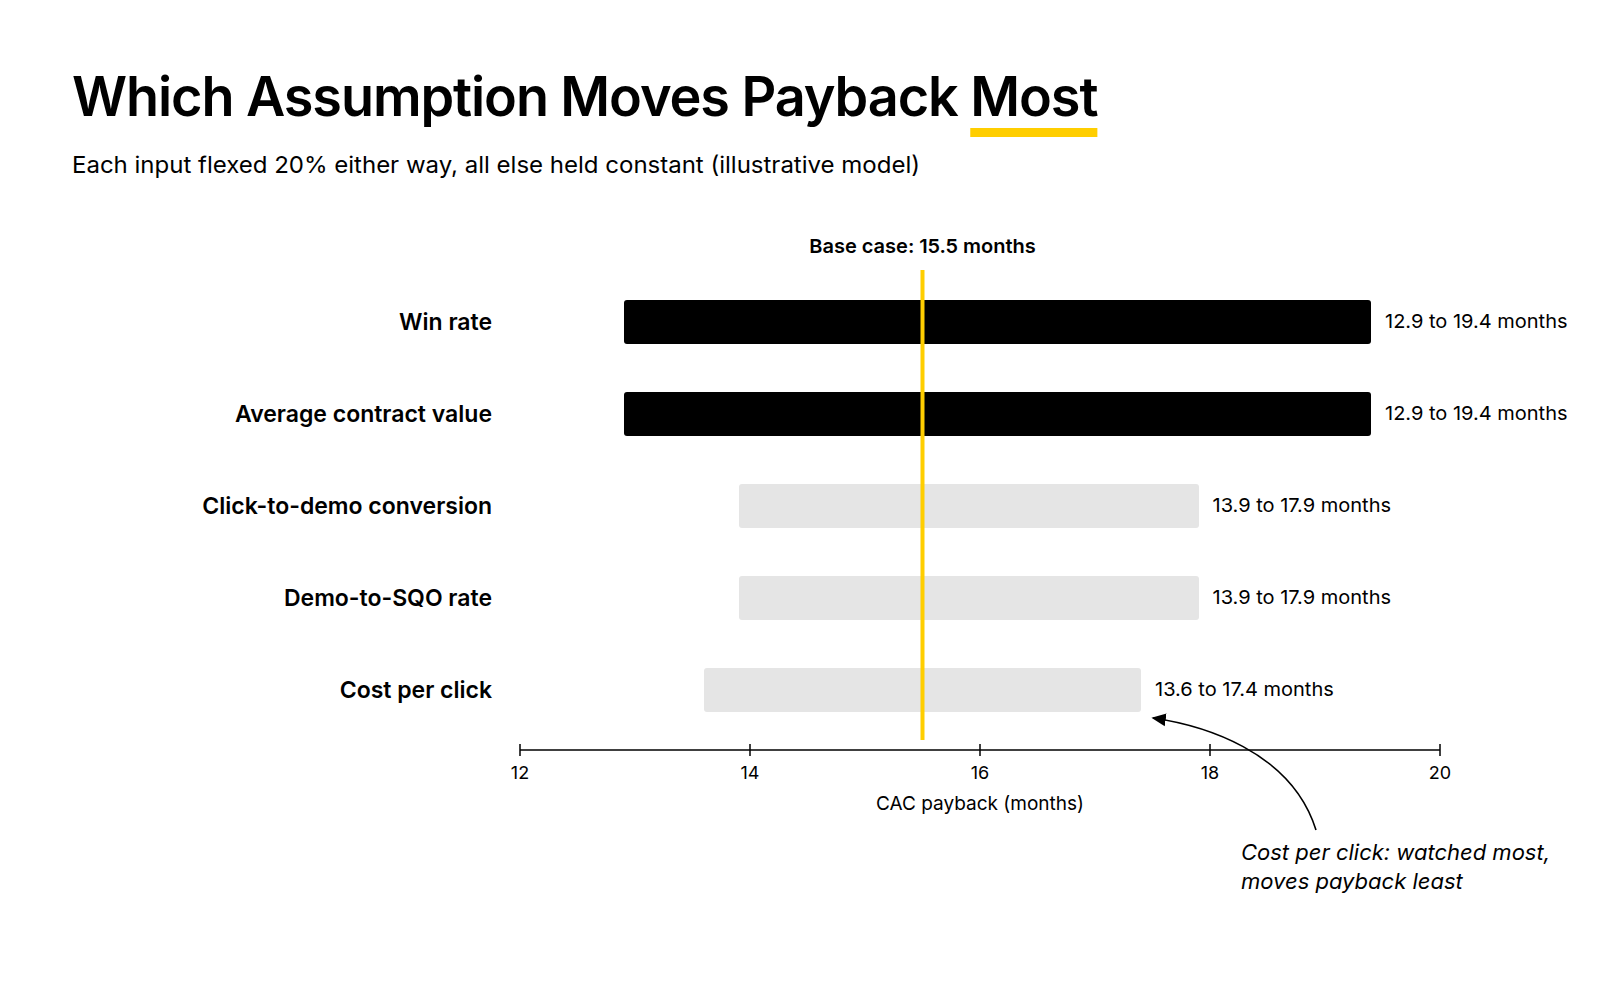
Win rate and ACV swing payback by six and a half months. Cost per click, the metric paid teams watch most closely, swings it by less than four. Win rate has more leverage because it affects both media cost and sales cost per customer.
The ranges are also lopsided. A 20% drop in win rate adds nearly four months, while a 20% improvement saves only two and a half. Downside risk is bigger than upside opportunity, which is exactly why a single base-case number misleads.
Three Scenarios: Base, Downside and Upside
Single-variable sensitivity shows where the risk sits. Real quarters rarely move one variable at a time, so the next step is combined scenarios.
- Base case: the inputs above. Payback of 15.5 months.
- Downside: conversion rate down 15%, cost per click up 10% and win rate down 10%, with the sales cycle stretching from four months to five. Payback rises to 20.4 months.
- Upside: conversion rate and win rate both up 10%, and ACV rises to £33,000 through better targeting. Payback falls to 12.1 months.
The honest answer to the board is therefore 12 to 20 months, with 15.5 most likely. That’s a less tidy answer than a single number, but it’s one that survives contact with the next two quarters.
How Sales Cycle Assumptions Change the Picture
The standard payback formula starts the clock when a customer signs. Your cash left the business months earlier, when you paid for the click.
Add the sales cycle to payback and you get spend-to-recovery time: how long the money is actually out of the business. In the base case, a four-month cycle plus 15.5 months of payback means 19.5 months from spend to recovery. Stretch the cycle to six months and that becomes 21.5 months, even though reported payback hasn’t changed at all.
Sales cycle assumptions also set the lag before the model can be checked. If your cycle is five months, spend made in Q1 can’t be judged on closed-won revenue until Q3 at the earliest. Plan for that lag explicitly. The alternative is cutting programmes on incomplete cohorts and calling it discipline.
The cash implications of longer cycles go well beyond paid media. We cover them in Understanding the Impact of CAC and Conversion Rates on Your Cash Runway.
Treat Marketing Attribution as a Model Input
Attribution is usually handled as a footnote: “figures based on CRM-sourced opportunities.” In long sales cycles with buying committees of six or more, that footnote hides one of the largest uncertainties in the model.
Make it a variable instead. Ask what share of paid-sourced customers would have arrived anyway, through referral, brand or a sales relationship that paid search simply intercepted. If 20% of attributed customers weren’t truly incremental, effective CAC rises to about £38,800 and payback to 19.4 months. That’s the same impact as a 20% fall in win rate.
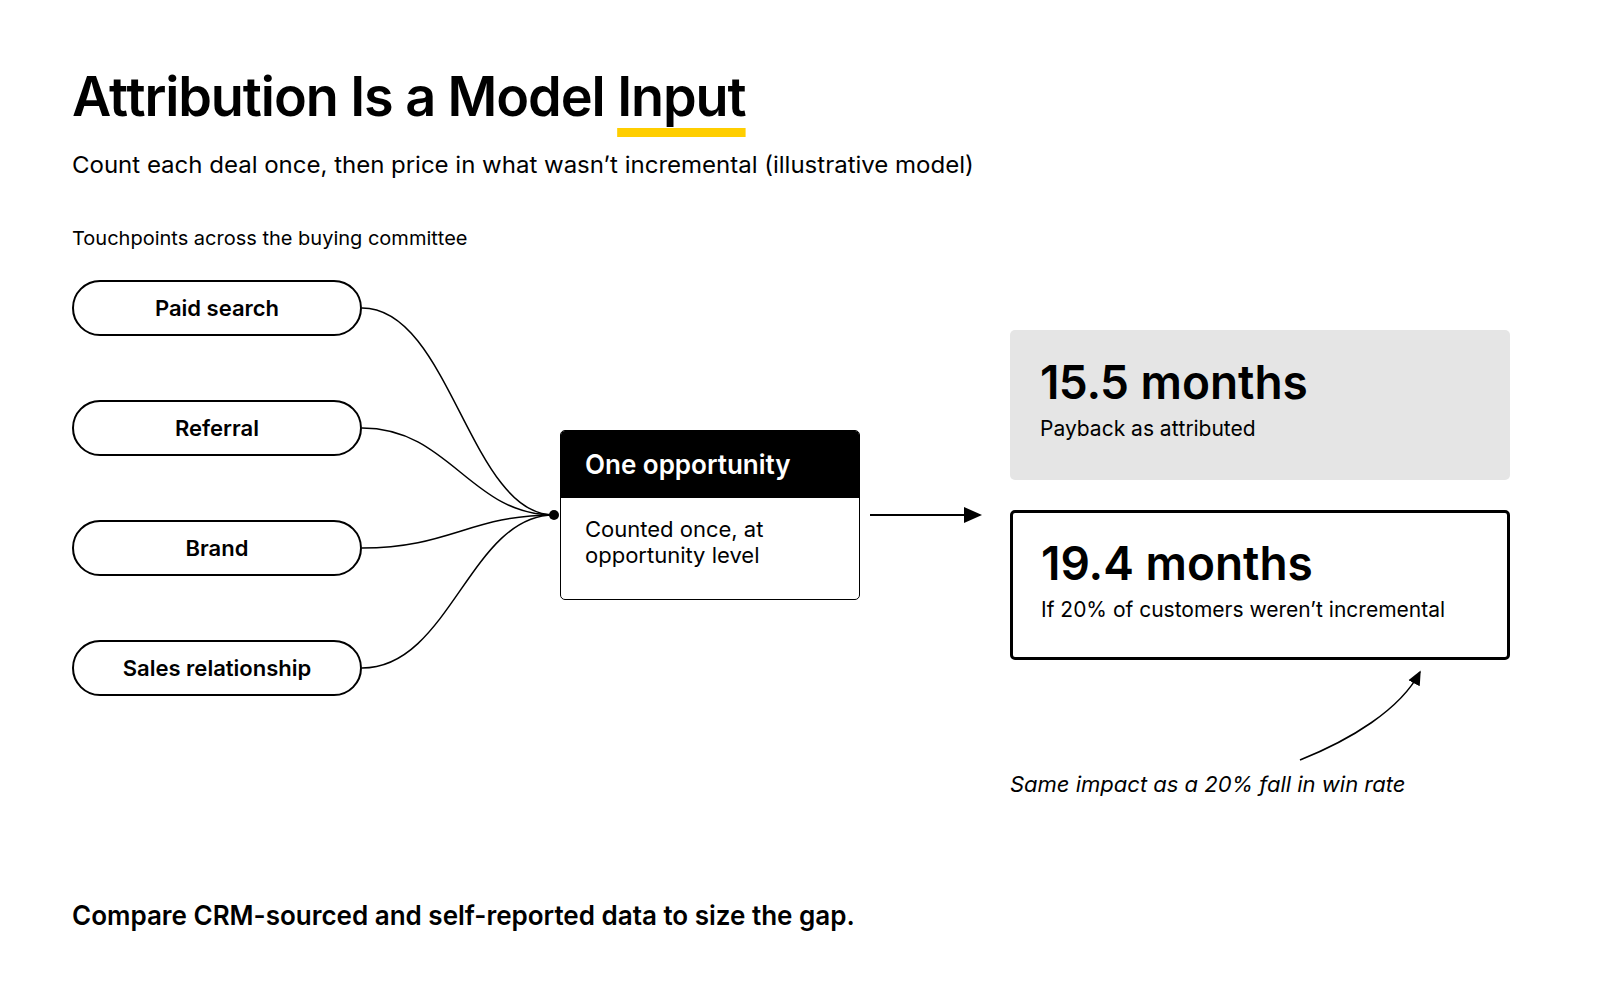
Three practices keep this variable honest:
- Attribute at opportunity level, not lead level, so a single deal with five stakeholders counts once.
- Compare CRM-sourced data with self-reported attribution from demo forms. The gap between them is a reasonable estimate of your attribution uncertainty.
- Run incrementality tests where volume allows, such as a geographic holdout or a paused segment, to replace the assumption with evidence.
Attribution will never be perfect. The point is to show the board you’ve priced the uncertainty in, rather than assumed it away.
Turning Scenarios Into Paid Media Strategies
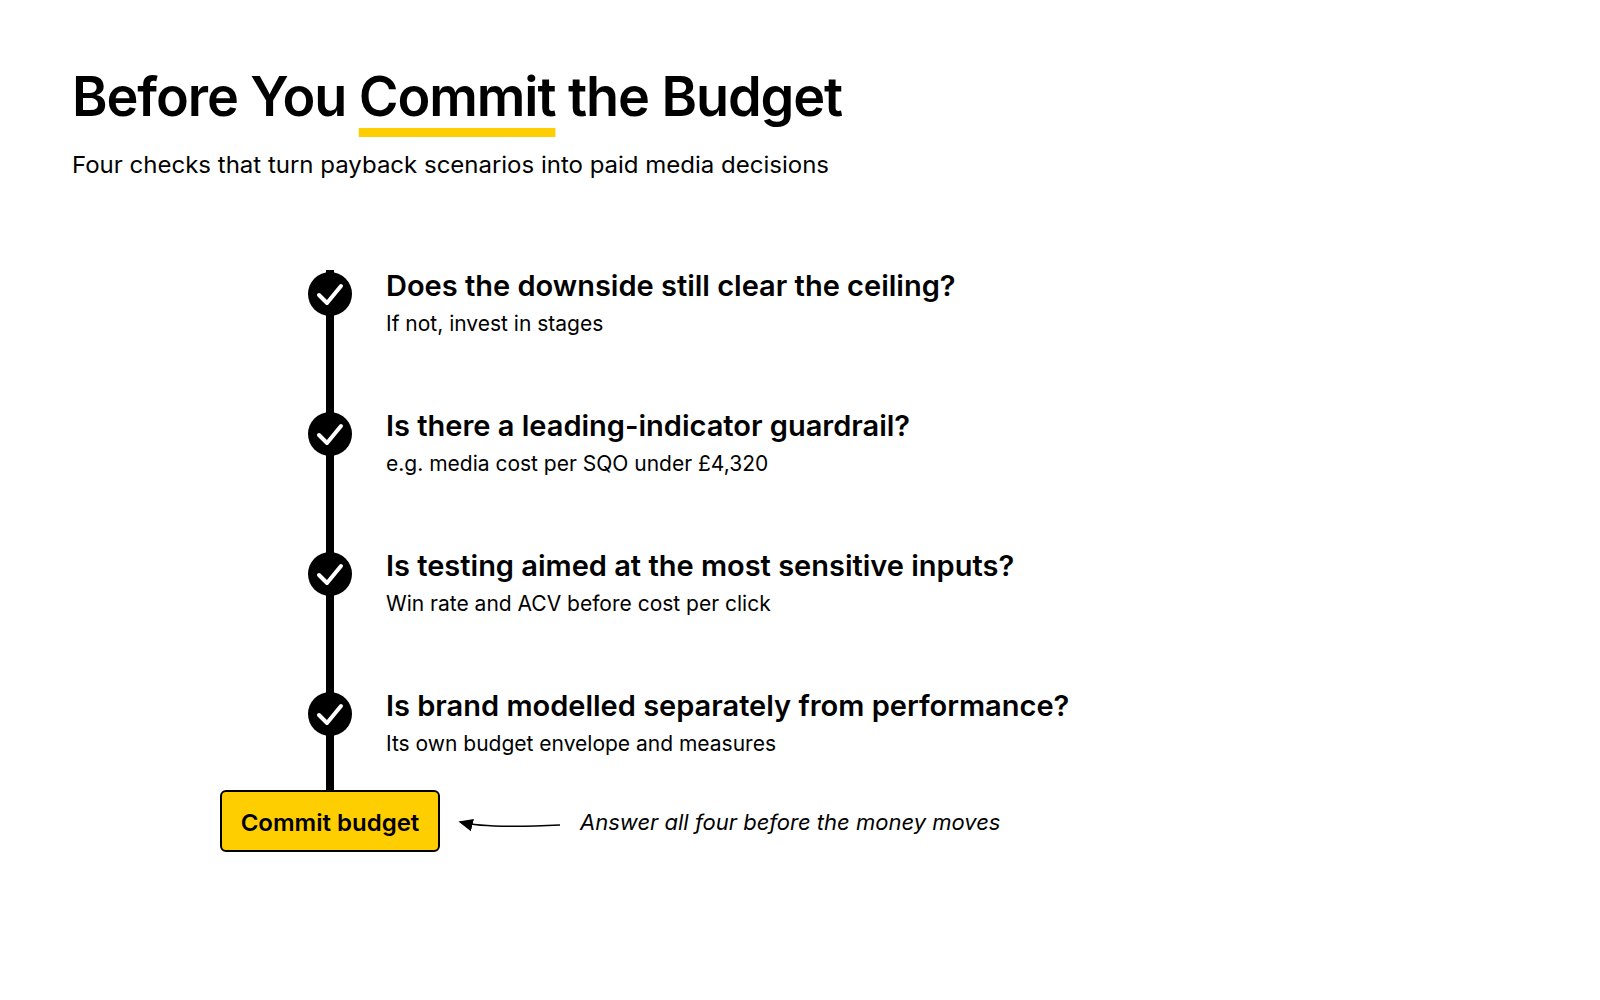
A model only earns its place if it changes decisions. These are the four that CAC payback scenario planning for SaaS advertising decisions should drive.
Scale When the Downside Still Works
Judge new investment against the downside case, not the base case. If the board’s ceiling is 18 months, the example programme has a problem: its base case passes comfortably, but its downside lands at 20.4 months.
That doesn’t mean don’t invest. It means invest in stages, with guardrails that tell you early which scenario you’re in.
Translate the Payback Target Into Leading-Indicator Guardrails
You won’t see payback for over a year. You’ll see cost per SQO within weeks. Work backwards from the target to find the leading indicator that keeps you inside it.
In the example, an 18-month ceiling allows a fully loaded CAC of £36,000. With an 18% win rate and £2,160 of sales cost per SQO, that means media cost per SQO must stay below about £4,320, against a base case of £3,430. That figure becomes the guardrail: a number the paid team can manage weekly and the CFO can trust.
Spend Testing Effort Where Sensitivity Is Highest
The sensitivity analysis is also a prioritisation tool. If win rate and ACV move payback most, optimising bids for a cheaper click is a weak use of effort. Tightening targeting towards accounts that close at higher rates and larger contract values is a stronger one. That usually means working with sales on ICP definitions and feeding closed-won data back into campaign targeting.
Model Brand Separately From Performance
Demand creation and brand activity don’t fit a twelve-month payback model, and forcing them into one guarantees they’ll be cut. Give them their own budget envelope, measured on leading indicators such as branded search growth and self-reported attribution. Keep them out of the performance model so each is judged on its own terms. How to split budget across those envelopes is covered in Aligning Paid Media Budget with CAC Payback Targets in SaaS.
Presenting Payback Scenarios to the Board
Data-driven marketing at board level isn’t about more data. It’s about showing you understand which numbers matter and how far they can move. A scenario-based narrative does that in four parts:
- The range: base, downside and upside payback, with the base case marked as most likely.
- The drivers: the two or three inputs that move payback most, and who owns each.
- The guardrail: the leading indicator you’ll manage against, and the threshold that triggers a review.
- The decision: what you’ll do if early data points to the downside, agreed before the money is spent.
This framing changes the conversation. Instead of defending a number that later turns out wrong, you’re reporting which scenario is playing out and what you’re doing about it. For the reporting setup underneath this, see our approach to board ready reporting.
Common CAC Payback Modelling Mistakes
The same errors come up repeatedly in payback models:
- Presenting a single point estimate. It implies a certainty no paid programme has.
- Using media-only CAC. Leaving out sales cost makes payback look more than a third shorter than it is.
- Flexing only marketing inputs. Win rate and ACV usually matter more than cost per click.
- Ignoring the sales cycle. Reported payback understates how long cash is out of the business.
- Treating attribution as fixed. Non-incremental conversions inflate the apparent efficiency of capture channels.
- Building the model once. Assumptions drift. Refresh the base case quarterly with actual cohort data.
Frequently Asked Questions
What is CAC payback and why is it important for SaaS companies?
CAC payback is the number of months it takes for a customer’s gross margin to cover what it cost to acquire them. It matters because it measures how long acquisition spend is tied up before it returns cash. Boards and investors use it to judge whether growth is efficient and whether the business can fund further acquisition.
How do conversion rates affect CAC payback period in SaaS?
Conversion rates set how much spend is needed to produce each customer, so lower rates raise CAC and lengthen payback. In a typical paid search model, a 20% fall in click-to-demo conversion can add two or more months to payback. Conversion rates later in the funnel, especially win rate, usually have an even larger effect.
What factors should be considered when modelling CAC payback scenarios?
Include cost per click, click-to-demo conversion rate, demo-to-SQO rate, win rate, average contract value, gross margin and sales cycle length. Add sales cost per opportunity for a fully loaded CAC. Treat attribution uncertainty as a variable too, because non-incremental conversions can distort payback as much as a fall in win rate.
How can variations in average contract value (ACV) influence CAC payback?
ACV sets how much gross margin each customer returns per month, so it has a direct, proportional effect on payback. A 20% lower ACV with the same CAC extends payback by a quarter. ACV often shifts with targeting, which is why moving paid media towards higher-value segments can shorten payback more than cheaper clicks.
What is the relationship between sales cycle length and CAC payback?
Sales cycle length doesn’t change the standard payback calculation, which starts when a customer signs. It does extend how long cash is out of the business, because spend happens months before revenue starts. Longer cycles also delay the point at which you can check your assumptions against closed-won data.
How can SaaS CMOs use CAC payback modelling to inform paid media strategies?
Use the downside scenario to decide whether to scale, and stage investment when the downside breaches the board’s ceiling. Translate the payback target into a leading-indicator guardrail, such as maximum cost per SQO. Then focus optimisation effort on the inputs the sensitivity analysis shows matter most.
What are the best practices for measuring CAC in a SaaS business?
Use fully loaded CAC, including media, tooling, agency costs and an allocated share of sales cost. Measure at opportunity level using closed-won data from the CRM, not platform-reported conversions. Segment by ACV band and channel, keep the definition consistent across reporting periods, and measure on spend cohorts to account for sales cycle lag.
How does attribution complexity affect CAC payback analysis in long sales cycles?
Long cycles with multiple stakeholders create many touchpoints, and attribution models often credit paid channels for deals they only intercepted. That inflates apparent efficiency. Model attribution uncertainty explicitly, compare CRM-sourced data with self-reported attribution, and use incrementality tests where volume allows to replace assumptions with evidence.
What metrics should SaaS CMOs focus on to optimise CAC payback?
Focus on fully loaded CAC, cost per SQO, win rate, ACV, gross margin and sales cycle length. Cost per SQO is the most useful leading indicator because it’s visible within weeks. Win rate and ACV usually have the most leverage, so they deserve attention even though they sit outside paid media’s direct control.
How can CMOs communicate CAC payback insights to stakeholders effectively?
Present a range rather than a single number: base, downside and upside scenarios. Name the two or three inputs that drive the range and who owns each. Agree a leading-indicator guardrail and the action you’ll take if early data points to the downside. That turns board reviews into progress updates rather than defences of a forecast.
If you’re building payback scenarios for next year’s paid media plan, this is the kind of modelling we work through with SaaS teams regularly. We’re happy to pressure-test your assumptions and show you which ones your payback really depends on.