Understanding the Impact of CAC and Conversion Rates on Your Cash Runway
Learn how CAC and conversion rates affect your cash runway and hiring plans. Align marketing and finance for sustainable growth.

You're sitting in a board meeting. The CFO asks a question you've heard before: what happens to our runway if conversion rates drop 10 percent. You don't have the answer. Neither does anyone at the table. That's when you realize scenario modelling isn't optional, it's survival.
Most marketing leaders operate on intuition. They set budgets based on historical spend, adjust for expected growth, and hope the numbers align with finance's runway forecasts. But Series B+ companies don't have room for that kind of guesswork. Your board is evaluating growth rates, unit economics, and runway length every quarter. If your marketing strategy doesn't directly ladder into those metrics, you're not aligned. You're a cost center, not a partner.
For detailed analysis of SaaS metrics, see SaaS Analytics.
Scenario modelling changes that dynamic. It forces you to articulate exactly how changes in Customer Acquisition Cost (CAC) and conversion rates ripple through your entire financial model. It shows your CFO that you don't just spend on marketing, you think like a finance person. More importantly, it gives you a tool to stress-test your assumptions before board meetings happen.
This isn't about building perfect forecasts. Forecasts are always wrong. This is about building a framework that lets you say, with clarity, what happens when conditions change. And that framework starts with understanding the mechanics.
The Mechanics: How CAC and Conversion Rates Feed Your Runway
Let's start with the math, because the math is unforgiving. Your cash runway is straightforward: cash on hand divided by monthly burn rate. If your burn rate is 500k per month and you have 5 million in the bank, your runway is 10 months. The question for marketing is: how does your spending and output change that burn rate.
Start with acquisition. You have a marketing budget. That budget produces leads. Some percentage of those leads convert to customers. The ratio of budget spent to revenue generated is your Customer Acquisition Cost (CAC). If you spend 100k on campaigns and bring in 10 customers worth 50k each, your CAC is 1k per customer.
Now add the conversion rate variable. Your CAC isn't fixed. It moves based on the efficiency of your sales process. A VP of Sales tells you the team can close 15 percent of qualified leads this quarter, then next quarter it drops to 10 percent because of competitive pressure. Suddenly the cost to acquire each customer goes up. Same marketing budget, fewer customers, higher CAC. Your runway just compressed.
Here's where scenario modelling kicks in. Instead of accepting that drop as inevitable, you model it. You ask: if conversion rates fall to 10 percent, what happens to our burn rate if we keep marketing spend flat. The answer: burn rate increases because you're generating fewer revenue-bearing customers. You then ask the second question: what do we cut from other parts of the budget to keep runway stable. That's the strategic conversation finance and marketing need to have together.
The typical VP of Marketing doesn't think this way because most dashboards don't force it. You see CAC. You see conversion rate. But those metrics live in separate sheets. Scenario modelling wires them together and shows you the cash impact.
Building Your First Scenario Model: The Framework
A scenario model for runway has three core components: assumptions, mechanics, and outputs.
Start with assumptions. These are the inputs you control (sort of) or need to forecast. What's your marketing budget for the next quarter. What's your blended conversion rate from lead to customer. What's your average deal size. What's your monthly burn rate excluding customer acquisition. Write these down. Be specific. Don't write "conversion rate 12 percent." Write "inbound conversion rate 8 percent, mid-market sales-assisted 18 percent, enterprise 25 percent." The granularity matters because CAC varies wildly by segment.
Next, the mechanics. This is where you link assumptions to outcomes. Take your marketing budget. Divide it by your cost per lead (which comes from your ad spend and click-through rate data). That gives you the number of leads. Take your lead number, multiply by your conversion rate, that gives you new customers. Take new customers, multiply by average deal size, that's new ARR. Take new ARR, multiply by your gross margin (because revenue isn't cash), that's the contribution your marketing generates. Subtract your burn rate. That's your monthly cash impact.
Finally, outputs. The key output is runway impact. How much longer or shorter is your runway if you execute this scenario versus the base case. A secondary output is hiring impact. If this scenario extends runway by six months, what does that let you hire. How many engineers. How much additional product development does that fund.
The power of this structure is that it forces clarity. You can't build a scenario model and hide assumptions. Every number has to come from somewhere. Every link has to be rationalized.
.jpeg)
Conversion Rate Volatility: The Unpredictable Variable
If CAC is forecastable, conversion rates are fickle. They move based on sales team changes, product changes, competitive dynamics, and random market factors. You can't control conversion rates. But you can plan for variance.
Most companies model three scenarios: base case (realistic expectation), upside (sales team is firing, product resonates), and downside (sales effectiveness drops, compression from competitive entry). A healthy scenario model includes at least 5 percent variance in both directions on conversion rate.
Here's why this matters. Assume your base case conversion rate is 15 percent. That might drive a forecast for 10 months of runway. But if the true distribution is 10 percent to 20 percent, your downside case might be 8 months and your upside 12 months. That's a four-month range. Your CFO needs to know that range exists. They need to know the scenarios that trigger the downside case. And they need to know what marketing spending changes you'd make if downside becomes reality.
The second insight: conversion rate variance compounds with CAC variance. If your conversion rate drops ten percent and, simultaneously, customer acquisition cost rises (because you're spending more to find the same number of leads due to ad fatigue), the impact on runway is severe. Scenario modelling lets you stack these stresses and see the combined effect.
Most teams don't do this. They model CAC and conversion rate as independent variables. They're not. In a constrained market, both degrade simultaneously. Your scenario model needs to capture that correlation.
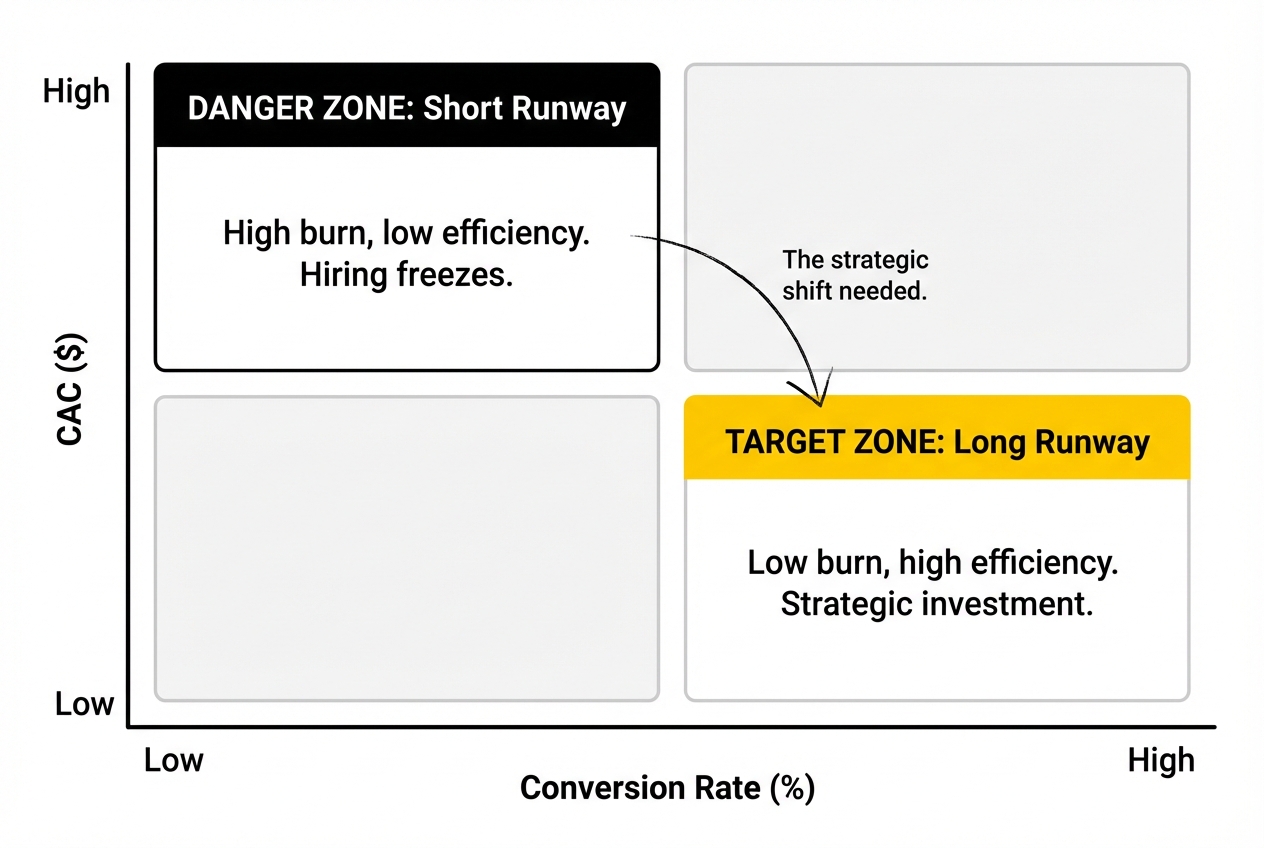
CAC and Hiring Plans: The Strategic Link
Here's where scenario modelling becomes a strategic tool, not just a forecasting exercise. Your runway determines how many people you can hire. Your headcount determines your burn rate. Your marketing productivity (which feeds CAC) determines how much revenue each new hire needs to generate.
Let's say your base case scenario shows 14 months of runway. Finance says you need 16 months to be comfortable scaling. That's a 2 month gap. You can close that gap three ways: cut burn, increase revenue, or reduce CAC. Marketing typically focuses on reducing CAC. You propose a new channel that brings CAC down from 15k to 12k. That increases productivity. Revenue per dollar of marketing spend goes up. Runway extends.
But here's the complexity: reducing CAC often requires hiring. A demand gen team. An operations person to manage attribution. An account-based marketing specialist. If CAC reduction requires investment before it generates savings, you need to model the timing. You might invest 100k in headcount now to save 200k in marketing spend quarterly. That's a positive trade, but not immediately. Your scenario model needs to show month-by-month cash impact, not just quarterly averages.
The teams that do this well treat scenario modelling as a collaborative exercise between marketing and finance. Marketing builds scenarios around CAC and conversion rate assumptions. Finance integrates those into hiring and burn models. The output is a shared picture of what headcount looks like under different growth scenarios.
Granular Attribution: The Foundation for Reliable Models
All of this depends on accurate CAC calculation. And accurate CAC depends on attribution. This is where most companies break down.
If you're running multiple channels, your CAC varies by channel. Paid search might have a 12k CAC. Partnerships might be 8k. Account-based marketing might be 50k because you're targeting enterprise accounts and the sales process is longer. A blended CAC of 15k obscures the fact that you have a highly profitable channel being subsidized by a less efficient one. Service Blueprint: What ‘SaaS PPC & Paid Search Management UK’ Should Actually Include, also on this blog, takes this further.
Scenario modelling needs granular data. You need to know CAC by channel, by segment (SMB, mid-market, enterprise), and by lead source. You need to know conversion rates by segment. You need to understand the sensitivity: if you cut partnership spending by 25 percent, how much does overall CAC rise. If you increase account-based marketing by 50 percent, what happens to your deal size and conversion rate.
This requires multi-touch attribution. It requires your marketing data (leads, sources) integrated with your CRM data (deal size, close rate, close time) and your finance data (actual customer value, NRR, expansion revenue). Many companies run these systems in parallel. The data never talks to each other. When that's the case, scenario modelling is guesswork.
The fix is intentional. You own the integration problem. Work with your analytics person or hire one. Build a single source of truth for acquisition metrics. Everything downstream from there gets more reliable.
Stress Testing: Building Resilience Into Your Model
Once your base case model is built, stress-test it. Ask hard questions. What if our biggest channel (usually Google Ads for B2B SaaS) faces a 30 percent cost increase due to competition. What if our conversion rate drops to the 10th percentile of our historical range. What if our average deal size compresses 20 percent due to product downgrades or downmarket movement.
Run these scenarios. Look at the outputs. If most stress tests result in runway compression below 12 months, your model is fragile. You need more optionality: lower burn alternatives, faster CAC reduction opportunities, or new revenue streams.
A healthy scenario model isn't one where the base case is perfect. It's one where you've gamed out the failures and built contingencies.
Most CFOs spend their board time asking about downside cases. If you come prepared with them already modelled, with specific answers about what happens and what you'd do about it, you shift from being a cost center to being a strategic partner.
.jpeg)
The Cross-Functional Meeting: Aligning Marketing and Finance
Scenario modelling only matters if finance believes it. And finance only believes it if you build it together.
Schedule a meeting with your CFO and head of finance. Walk them through your assumptions: CAC by channel, conversion rates by segment, blended deal size, gross margin. Ask them to pressure-test each one. They'll catch assumptions you've missed. They'll offer finance perspective on what matters most.
Then walk them through the mechanics. Show them the spreadsheet. Show them how a 10 percent change in conversion rate flows through to runway impact. Let them modify the model. Ask them to run scenarios from their side: what if our burn rate increases due to unexpected headcount. How much does that change the runway impact of your marketing scenarios.
This isn't a presentation. It's a working session. By the end, you both own the model. When board time comes, finance isn't defending marketing's assumptions. You're defending shared assumptions.
The teams that do this well hold quarterly scenario modelling reviews. Every quarter, they update assumptions based on actual performance. They rerun scenarios. They evaluate which risks materialized. They adjust strategies. They turn forecasting into a living discipline.
Practical Implementation: From Spreadsheet to Action
Start simple. Don't build a perfect model. Build a working model. Three scenarios: base, upside, downside. Six months of visibility. Two to three channels. One metric for conversion rate.
Put this in a spreadsheet. Use formulas that link assumptions to outputs. Every change to CAC or conversion rate automatically updates runway.
Now use it. When your sales leader says conversion rates might drop, plug in the number. See what it means for runway. Now you have a conversation about how to mitigate it. You're not guessing. You're strategizing.
Over the next quarter, add complexity. Add more channels. Add segment-level granularity. Add hiring impact. Add cohort analysis showing how customer quality (CAC and payback period) varies by acquisition source.
But do it incrementally. The goal isn't a perfect model. It's a model that your finance team trusts and that forces you to think like a finance person about your marketing decisions.
For deeper insights, see Understanding Net Revenue Retention, Expansion, and Churn in SaaS PPC.
Frequently Asked Questions
How do changes in CAC affect a SaaS company's cash runway?
CAC directly impacts revenue generation per dollar spent. Higher CAC means fewer customers per marketing dollar, reducing revenue contribution and shortening runway. If CAC increases 20 percent without offset (higher conversion rate or deal size), monthly cash burn effectively increases relative to revenue generated, compressing runway. Scenario models quantify this impact.
What role do conversion rates play in determining financial sustainability for SaaS companies?
Conversion rates determine how efficiently your leads convert to customers. Lower conversion rates mean the same marketing budget generates fewer customers, increasing effective CAC and reducing revenue contribution. Conversion rate volatility is a primary driver of runway variance, making it critical to model multiple scenarios around this metric.
How can VPs of Marketing build effective scenario models linking CAC and conversion rates?
Start with clear assumptions: marketing budget, cost per lead, conversion rates by segment, average deal size, and gross margin. Build a spreadsheet that links these assumptions to outputs: new customers, new ARR, revenue contribution, and runway impact. Use formulas to show how changes in CAC or conversion rate cascade through your model.
What are the best practices for aligning marketing and finance teams in SaaS companies?
Build your scenario model collaboratively with finance. Walk them through assumptions and mechanics. Let them pressure-test and modify. Hold quarterly reviews to update assumptions based on actual performance. Share scenario outputs widely so both teams own the forecasts.
How can granular attribution demonstrate ROI in complex B2B sales cycles?
Granular attribution tracks CAC by channel and segment, showing which acquisition sources deliver the best economics. In B2B, this often reveals that indirect channels (partnerships, events) have lower immediate CAC but higher customer quality (better payback, higher NRR). Multi-touch attribution connects marketing touch points to closed deals, quantifying ROI in long sales cycles.
What actionable strategies can VPs of Marketing implement to adapt budgets based on performance insights?
Use scenario models to identify high-sensitivity metrics. If conversion rate variance has the biggest runway impact, focus on improving sales enablement. If CAC by channel varies widely, shift spend toward lower-CAC channels. Run scenarios showing the impact of reallocating budget. Use these to inform quarterly budget decisions.
How do deal size and CAC impact hiring plans in Series B+ SaaS companies?
Deal size and CAC together determine revenue per customer and customer payback. Larger deal size with lower CAC is optimal for hiring capacity (higher LTV). If both compress, hiring becomes constrained. Scenario models let you show finance that hiring a demand gen person (cost) that reduces CAC (benefit) extends runway by six months.
What metrics should be monitored to ensure consistent quarter-over-quarter growth in SaaS?
Monitor CAC by channel and segment. Track conversion rates by stage (lead to opportunity, opportunity to customer). Monitor deal size trends. Track customer payback and LTV. Most importantly, monitor the relationship between these metrics and runway impact. A rising CAC paired with falling conversion rate is a yellow flag.
How can scenario analysis improve decision-making for marketing budgets?
Scenario analysis replaces intuition with data. Instead of assuming your budget will work, you model what happens if conversion drops, CAC rises, or deal size compresses. You see the range of outcomes. You identify which risks are most material. You make budget decisions based on stress-tested scenarios, not hopes.
What are the key components of a successful financial model for SaaS companies?
Clear assumptions (sourced from actual data), transparent mechanics (formulas that link inputs to outputs), granular granularity (CAC by channel, conversion by segment), multiple scenarios (base, upside, downside), and regular updates (quarterly reviews). The best models are collaborative between marketing and finance, owned by both teams.
---