Aligning Paid Media Budget with CAC Payback Targets in SaaS
A practical framework for Series B+ SaaS teams: band paid channels by CAC payback, model the budget split against your target and reallocate with confidence.

The CFO asks a simple question in the monthly review: if we put another £200k into paid media next quarter, when do we get it back? Most VPs of Marketing can answer with a blended number. Very few can answer by channel.
That gap is where budget arguments start. SaaS budget allocation by CAC payback period closes it. Instead of splitting spend by habit, last year’s plan or platform-reported ROAS, you split it by how quickly each channel recovers its acquisition cost. Then you manage the mix so the blended number lands on the target the board has agreed.
This is the framework we use on b2b saas growth programmes at Series B and beyond. It covers how to set the target, how to band channels, how to calculate the split, and how to reallocate without breaking the pipeline you’ll need in three quarters’ time. If you want a refresher on the underlying maths first, we’ve covered it in Mastering CAC, LTV, and Payback Period in B2B SaaS Marketing. This article assumes the formula and focuses on what to do with it.
Why CAC Payback Should Drive the Budget Split
CAC payback period is the number of months of gross-margin-adjusted revenue it takes to recover the cost of acquiring a customer. The standard formula is CAC ÷ (monthly revenue per customer × gross margin %).
Payback is the language your CFO already speaks. It converts marketing spend into a cash question: how long is this money tied up before it comes back? ROAS can’t answer that. It ignores gross margin, it ignores the sales cycle, and in B2B it usually measures a form fill rather than closed-won revenue.
The spread across the market shows why a single benchmark won’t settle the debate. Benchmarkit’s 2026 SaaS and AI Performance Benchmarks, covering 342 B2B SaaS and AI-native companies, put the 2025 median CAC payback period at 16 months, with the top quartile at 6 months or fewer and the bottom quartile at 24. The same budget can be disciplined in one business and reckless in another, depending on ACV, retention and cash position.
That is the real cac payback period impact on SaaS marketing budget decisions. It moves the conversation from “is paid media working?” to “which parts of paid media pay back fast enough, and which parts are we funding for future pipeline?”
Step One: Agree the Payback Target Before You Split Anything
The payback target is a finance decision. Marketing should shape it, but the board and CFO own it, because it depends on things marketing doesn’t control.
The inputs that matter most:
- Cash runway: less runway means a shorter acceptable payback, regardless of growth ambitions.
- Net revenue retention: strong expansion revenue justifies a longer payback, because each customer keeps paying back after the initial recovery.
- Gross margin: lower margins stretch payback for the same CAC.
- ACV and segment mix: enterprise deals carry longer payback than mid-market, and blending them hides both.
Agree two numbers, not one. The first is the blended target for the whole paid programme. The second is a ceiling for any single programme, for example no channel running above twice the blended target without explicit sign-off. The ceiling stops one experimental channel quietly absorbing a quarter’s budget.
Then agree the CAC definition and don’t change it mid-year. We recommend paid media CAC that includes media spend, agency and tooling costs, and an allocated share of SDR cost for the leads that channel generates. Whichever definition you choose, consistency matters more than precision.
Step Two: Band Every Channel by CAC Recovery Time
Once the target is set, sort your paid activity into payback bands. This is the core of SaaS expenditure distribution by CAC recovery time: each band has a different job, and each gets judged against a different expectation.
- Fast payback (under 12 months): brand search, high-intent non-brand search, competitor terms backed by strong comparison pages, and review-site placements on G2 or Capterra. These capture demand that already exists.
- Medium payback (12 to 24 months): LinkedIn retargeting to engaged accounts, problem-aware search terms, and event or webinar promotion to ICP audiences. These move partially aware buyers towards evaluation.
- Long or indirect payback (over 24 months, or not directly measurable): cold-audience LinkedIn and YouTube, content syndication and ABM display. These create the demand the fast band later captures.
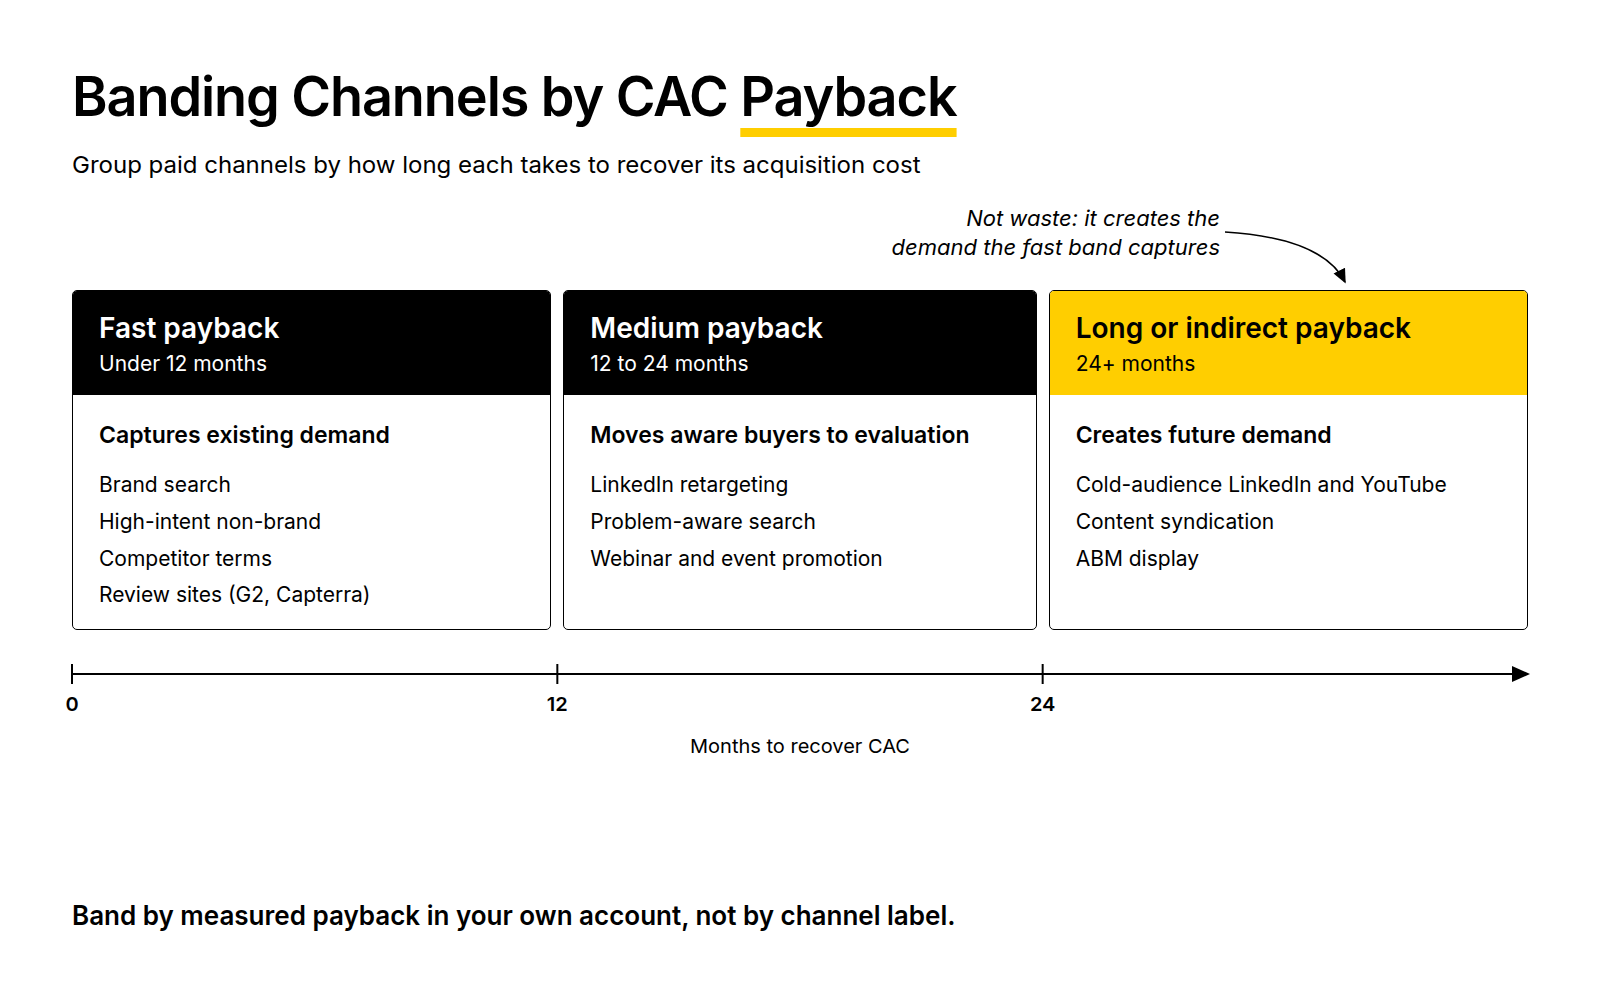
Band by measured payback in your own account, not by channel label. A tightly targeted LinkedIn programme can sit in the fast band for one business and the long band for another. If you don’t yet have enough closed-won data, our guide to channel-level CAC benchmarks for B2B SaaS is a reasonable starting reference until your own cohorts mature.
The long band is not waste. It is the feedstock for the fast band. Most SaaS teams that cut it to hit a payback target see branded search volume and direct demo requests soften two or three quarters later, at which point the payback problem returns with less pipeline behind it.
Step Three: Calculate the Split That Hits the Blended Target
Blended payback is not the simple average of your channel paybacks. It is total spend divided by the monthly gross margin of all the customers that spend acquired. Cheap-to-acquire channels add customers quickly, while expensive channels dilute the total. That makes the arithmetic less intuitive than most budget spreadsheets assume.
Use these as starting points, then adjust to your own data:
- Target of 12 months or less: around 60 to 70% fast band, 20 to 30% medium, about 10% long.
- Target of 12 to 18 months: around 45 to 55% fast, 25 to 35% medium, 15 to 20% long.
- Target of 18 to 24 months: around 35 to 45% fast, 30 to 35% medium, 20 to 30% long.
The fast band has a capacity limit. Search demand is finite, so each extra pound in brand and high-intent search buys less than the last. Always model the marginal CAC of the next spend tranche, not the average CAC of what you’re already spending. We’ve written about this ceiling in more detail in Optimising Paid Budget Allocation as SaaS Search Demand Saturates.
The process, in order:
- Pull four to six quarters of closed-won revenue by channel, lag-adjusted for your sales cycle.
- Calculate CAC and payback for each channel.
- Estimate the marginal CAC of the next spend tranche in each channel.
- Model splits until the blended payback hits the agreed target.
- Set a minimum floor for the long band before finalising.
- Lock the split for the quarter and review performance monthly.
A Worked Example
Consider an illustrative Series B workflow automation platform selling to mid-market companies. ACV is £40,000 and gross margin is 80%, so each customer returns about £2,667 of gross margin per month. The board has set an 18-month payback target, and the quarterly paid media budget is £600,000.
The current split looks like this:
- High-intent search: 20% of budget, CAC £30,000, payback around 11 months.
- Review sites and competitor terms: 10%, CAC £40,000, payback 15 months.
- LinkedIn: 45%, CAC £80,000, payback 30 months.
- Content syndication and display: 25%, CAC £120,000, payback 45 months.
That mix acquires roughly 10 customers a quarter at a blended CAC of about £59,000. Blended payback is 22 months, four months over target.
The first move is reallocation. Search rises to £180,000, though the extra £60,000 costs more per customer, around £40,000. Review and competitor spend doubles to £120,000, again with the second half buying at a higher marginal CAC of about £48,000. LinkedIn drops to £240,000 and syndication to £60,000. The result is about 11.75 customers, a blended CAC of roughly £51,000 and a payback of 19 months. That’s better, but still over target.
The remaining gap closes through efficiency, not budget. Tighter ICP lists, stronger exclusions and a sharper offer bring LinkedIn CAC down from £80,000 to £64,000. At the same £240,000, LinkedIn now delivers 3.75 customers instead of 3. The total reaches 12.5 customers at a blended CAC of £48,000, which is exactly 18 months.
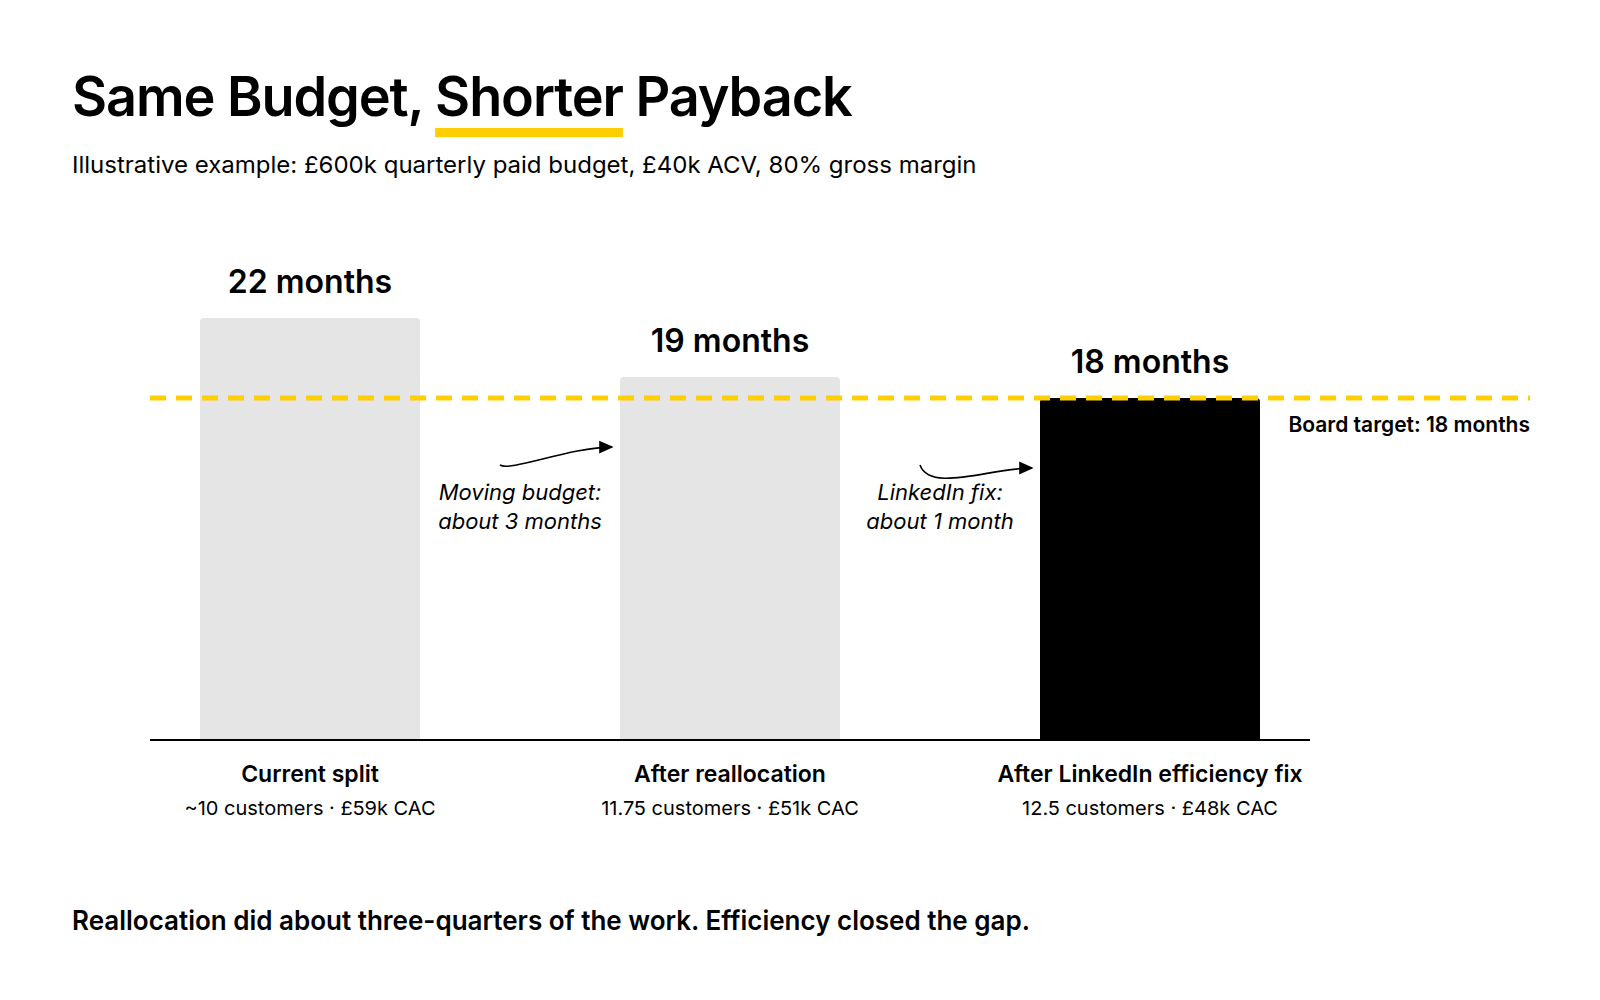
Reallocation did about three-quarters of the work. Teams that rely only on shifting budget towards capture eventually hit the search ceiling and stall. Note also what didn’t happen: LinkedIn wasn’t cut to zero, because it feeds the pipeline that search converts. When you want to stress-test splits like this across several scenarios, that’s the territory of CAC Payback Scenario Modelling for SaaS Paid Media Decisions.
Account for Sales Cycle Length Before Judging a Channel
Long sales cycle budget management starts with one fact: the payback clock starts when you spend, but revenue only starts when the deal closes. With a four to six month cycle, this quarter’s closed-won revenue mostly reflects spend from two quarters ago.
Judging channels on in-quarter closed-won will consistently punish the medium and long bands. Measure on cohorts instead. Group spend by the quarter it was made, track the opportunities it created, and attribute closed-won back to that cohort as deals land.
For channels too new to have closed cohorts, use a forecast payback. Divide cost per sales-qualified opportunity by your win rate to get a predicted CAC, then divide by monthly gross margin per customer. Replace the forecast with actuals as each cohort closes. Good b2b sales cycle marketing strategies treat that forecast as a hypothesis to be tested, not a result to be defended.
Funnel maturity matters here too. A new channel needs a maturity allowance: typically two quarters judged on leading indicators such as cost per SQO and ICP account engagement, with exit criteria agreed before launch. Without pre-agreed criteria, new channels either get killed before they’ve had a fair test or survive long after they should have been cut.
Granular Attribution Makes the Bands Trustworthy
Payback bands are only as reliable as the attribution behind them. Granular attribution in SaaS marketing doesn’t need a six-figure tool. It needs a few disciplines applied consistently:
- Campaign-level UTMs passed into the CRM and stored against the opportunity, not just the lead.
- Opportunity-level attribution, so you measure pipeline and revenue rather than MQLs.
- ACV segmentation, so enterprise and mid-market deals don’t distort each other’s payback.
- A self-reported attribution field on demo forms, asking how the buyer heard about you.
Attribution will never be perfect, and in long buying journeys with six or seven stakeholders it can’t be. The goal is consistent, directional data. Read two lenses side by side: CRM-sourced attribution, which is conservative, and self-reported attribution, which captures the dark social and word-of-mouth influence that click tracking misses. Where the two disagree, it’s almost always about long-band channels, and that disagreement is useful evidence in budget conversations.
For measuring marketing spend impact on revenue in a way that holds up under board scrutiny, our guide to board-defensible SaaS attribution covers the setup in depth.
Marketing Budget Reallocation Strategies That Survive CFO Review
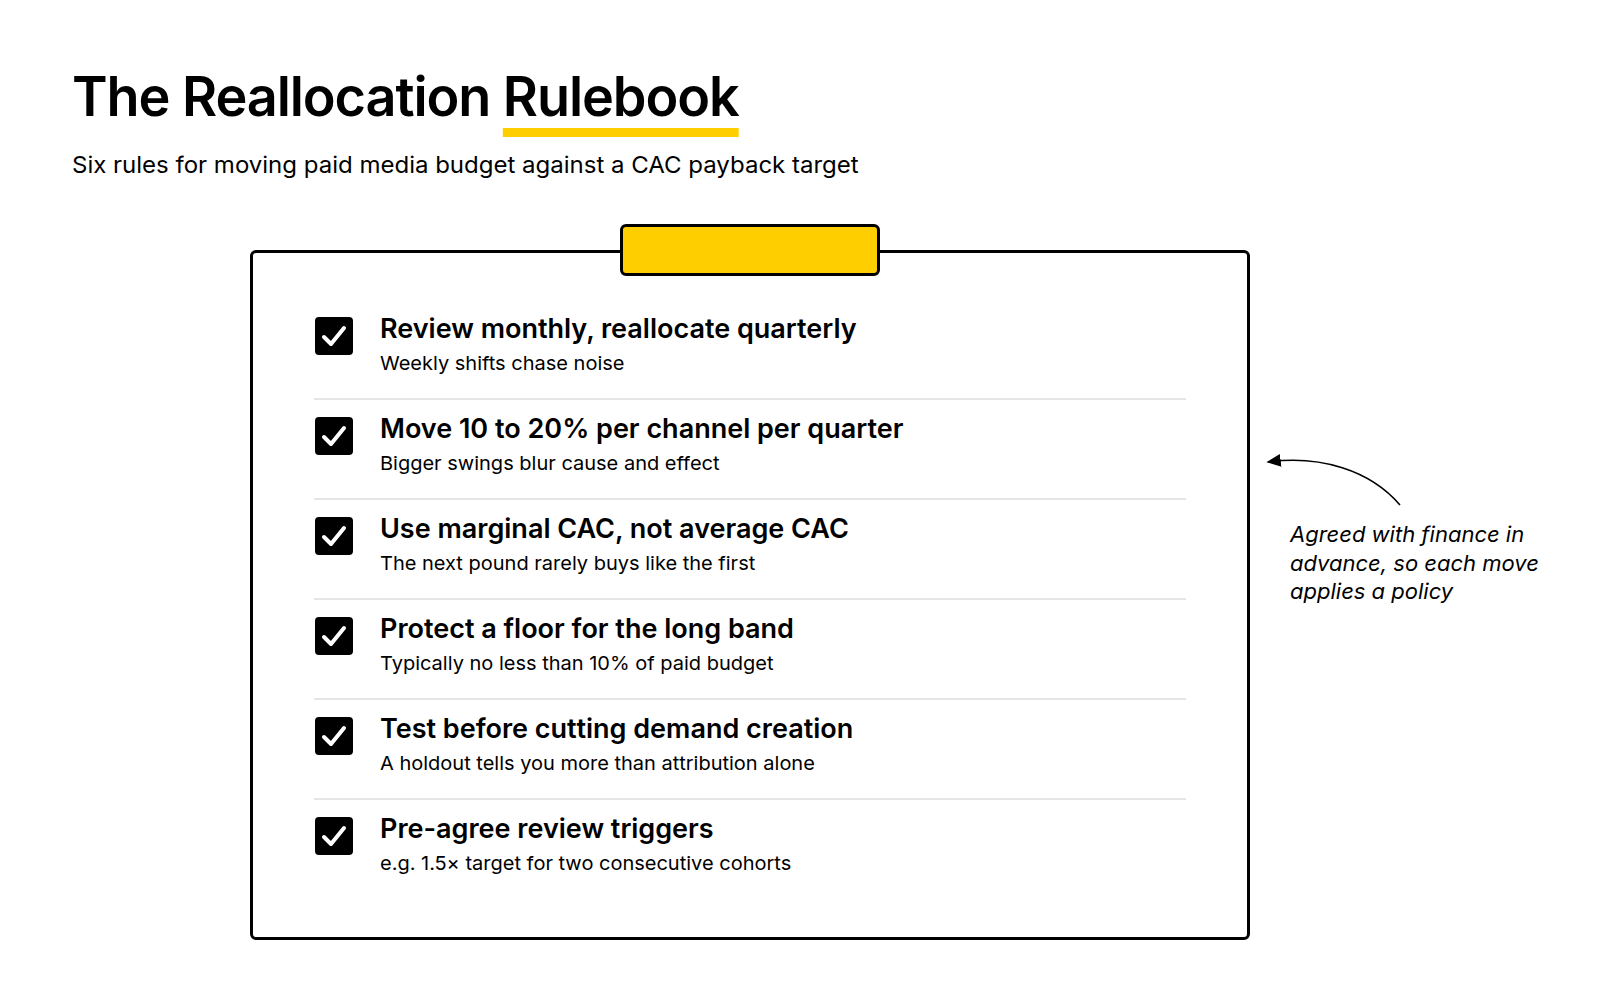
Revenue accountability in SaaS marketing isn’t about defending every line item. It’s about having rules for when budget moves, so changes look deliberate rather than reactive.
- Review monthly, reallocate quarterly. Weekly shifts chase noise, especially with long sales cycles.
- Move in increments of 10 to 20% per channel per quarter. Larger swings make it impossible to separate the effect of the move from market changes.
- Use marginal CAC, not average CAC, when deciding where the next pound goes.
- Protect a floor for the long band, typically no less than 10% of paid budget.
- Test before cutting demand creation. A geographic holdout or a paused segment for one quarter tells you far more than attribution data alone.
- Pre-agree triggers. For example, any channel running above 1.5 times the blended target for two consecutive cohorts goes to review.
The value of these rules is that they’re agreed with finance in advance. When a reallocation comes up, you’re applying a policy, not making a case from scratch.
Document Every Budget Decision
The most underrated of the marketing budget documentation best practices is a simple decision log. For every reallocation, record the date, the change, the rationale, the data used, the expected payback effect and a review date.
Six months later, that log answers the questions the board will ask: why did LinkedIn spend fall in Q2, and did it work? It also protects continuity. When a team member leaves or an agency changes, the reasoning stays with the business. How to present this to the board is a separate skill, covered in Structuring Board Packs for Series A+ SaaS.
Customer Acquisition Cost Strategies That Shorten Payback
Reallocation moves the mix. Efficiency improves the channels themselves. The worked example above needed both, and most real programmes do too.
The interventions that most reliably shorten payback in paid media:
- Tighten ICP targeting and exclusions, particularly on LinkedIn and paid social, where audience drift quietly inflates CAC.
- Shift towards higher-ACV segments where sales capacity allows, since payback improves with revenue per customer, not just lower CAC.
- Improve demo-to-opportunity conversion through better landing pages, form routing and qualification questions.
- Cut speed to lead. Faster follow-up shortens cycles and lifts win rates on the same spend.
- Prune search terms by opportunity rate, not conversion rate. Terms that generate demos sales won’t progress are pure CAC inflation.
- Work with finance on billing terms. Annual upfront billing doesn’t change accounting payback, but it transforms cash payback.
If you’re optimising SaaS marketing budget performance, start with the channel furthest over target. That’s usually where efficiency gains are largest and cheapest to find.
Common Pitfalls in Payback-Based Budget Allocation
A few mistakes come up repeatedly when teams adopt this approach:
- Managing only to blended payback. A healthy blended number can hide one channel at 40 months propped up by brand search.
- Judging long-cycle channels on in-quarter revenue. This systematically defunds the pipeline you’ll need later.
- Cutting demand creation to hit a target. It works for two quarters, then capture channels weaken.
- Using average CAC for marginal decisions. The next pound in brand search never performs like the first.
- Changing the CAC definition mid-year. It breaks trend lines and erodes trust with finance.
- Relying on platform-reported conversions. Ad platforms measure their own contribution generously. The CRM is the source of truth.
Putting the Framework Into Practice
For most Series B+ teams, the sequence is straightforward. Agree the target and CAC definition with your CFO. Band your channels using lag-adjusted cohort data. Model the split using marginal CAC, with a floor for demand creation. Then reallocate quarterly against pre-agreed rules and log every decision.
None of this requires perfect data. It requires consistent data and a shared rulebook between marketing and finance. Those two things turn budget reviews from a defence into a planning conversation.
Frequently Asked Questions
What is a good CAC payback period?
For B2B SaaS, under 18 months is broadly accepted, and under 12 months is strong. The right target depends on ACV, net revenue retention and cash runway. Enterprise businesses with high expansion revenue can justify longer payback, while companies with weaker retention or limited runway need shorter payback to grow without straining cash.
What is the payback period in SaaS?
The payback period is the number of months it takes for a customer’s gross-margin-adjusted revenue to cover what it cost to acquire them. It’s calculated as CAC divided by monthly revenue per customer multiplied by gross margin. It’s widely used by boards and investors as a measure of acquisition efficiency and cash risk.
How can I optimise my marketing budget allocation based on CAC payback targets?
Agree a blended payback target with finance, then calculate payback for each channel using lag-adjusted cohort data. Group channels into fast, medium and long payback bands, and model splits using marginal rather than average CAC. Protect a minimum budget for demand creation, and reallocate quarterly in measured increments.
What factors influence the CAC payback period in B2B SaaS companies?
The main factors are ACV, gross margin, sales cycle length, win rate and channel mix. Buying committee size matters too, because more stakeholders mean longer cycles and more touchpoints before close. Pricing and billing terms affect cash payback, and targeting quality affects how much spend reaches genuine ICP buyers.
How does the CAC ratio impact overall SaaS business health?
The CAC ratio shows how much you spend on sales and marketing to win £1 of new ARR. It links directly to payback: at 80% gross margin, a ratio of 1.5 implies a payback of about 22.5 months. A rising ratio signals that growth is getting more expensive, which affects cash burn, runway and valuation.
What strategies can be employed to improve CAC payback period?
Reallocate budget towards channels with faster payback, while protecting demand creation. Improve efficiency within slow channels through tighter ICP targeting and exclusions. Raise demo-to-opportunity conversion, reduce speed to lead, prune search terms by opportunity rate, and move towards higher-ACV segments. Annual upfront billing can significantly improve cash payback.
How can granular attribution enhance budget allocation decisions in SaaS marketing?
Granular attribution lets you calculate payback by channel, campaign and ACV segment rather than relying on a blended figure. That shows which programmes are genuinely efficient and which are carried by others. Combining CRM-sourced data with self-reported attribution gives a more complete view, especially for channels that influence deals without getting the last click.
What role does the sales cycle length play in determining CAC payback?
Sales cycle length delays revenue, so spend made this quarter may not produce closed-won revenue for two or more quarters. Judging channels on in-quarter results penalises longer-cycle activity. Measure payback on spend cohorts instead, and use forecast payback based on cost per SQO and win rate until those cohorts close.
How can case studies inform budget reallocation strategies in SaaS?
Case studies show how reallocation plays out over time, including effects that attribution misses, such as branded search falling after demand creation is cut. The most useful ones come from your own account history. A budget decision log turns every past reallocation into an internal case study you can reference.
What metrics should be tracked to measure the effectiveness of marketing spend in relation to revenue outcomes?
Track CAC and CAC payback by channel, cost per sales-qualified opportunity, opportunity-to-close win rate, pipeline created by cohort, and closed-won revenue by source. Add ACV by channel and the blended CAC ratio. These SaaS marketing performance metrics connect spend to revenue in terms finance and the board will recognise.
If you’re working through how to split next year’s paid budget against a payback target, this is the kind of problem we dig into with SaaS teams regularly. We’re happy to take a look at your current mix and where the payback is really coming from.