Measuring Lead Quality in SaaS PPC: From MQLs to Revenue
Practical strategies to measure PPC lead quality in SaaS, from early-funnel signals to CRM stage alignment, without waiting 6 months for revenue data.

Your platform metrics are green. CPL is down. Lead volume is up. Then the quarterly pipeline review happens and the sales team have a very different read of the situation.
This is the central tension in SaaS PPC: the signals that are easiest to track are the ones least connected to revenue. Form fills take seconds to register. Closed-won deals take months. By the time you know whether last quarter’s campaigns were actually working, you have already spent the next quarter’s budget on the same mix.
The answer is not to wait for closed-won data. It is to build a measurement framework that gives you directional signal much earlier, and to feed that signal back into how you bid and report. This article covers how to do that practically, without rebuilding your entire MarTech stack. For the broader paid media context, the SaaS PPC hub covers how measurement fits into a full campaign strategy.
Why MQL Volume Is a Misleading Success Metric
Most SaaS PPC accounts are still optimising for the wrong thing. Google Ads learns from whatever conversion actions you designate as primary, and for most teams, those actions are form fills or demo requests. Those events happen quickly, which makes them easy to optimise toward. But they are a proxy for quality, not a measure of it.
The gap is significant. According to 2025 B2B SaaS funnel data, PPC-sourced leads convert from MQL to SQL at just 26%, compared to 51% for SEO-sourced leads. That gap compounds through every downstream stage. High MQL volume from paid campaigns can look like traction until you trace those leads to opportunity and closed-won, at which point the picture changes.
The MQL metric has another weakness: it is only as reliable as the definition behind it. If marketing and sales are not aligned on what an MQL means, your MQL-to-SQL rate is measuring nothing. It is just tracking how many leads cleared an arbitrary threshold that may or may not correlate with sales intent.
This is not a reason to abandon the MQL entirely. It is a reason to use it as one input in a wider framework rather than the headline number in your weekly PPC report.
The Early-Funnel Signals That Actually Predict Revenue
Waiting for closed-won data before making bidding decisions is not practical. Sales cycles for mid-market SaaS typically run 60 to 90 days, and enterprise deals regularly stretch to six months or longer. You cannot steer a live account backwards.
What you can do is identify the micro-events that reliably correlate with closed-won outcomes in your specific pipeline, and start tracking them within days of a lead entering your CRM.
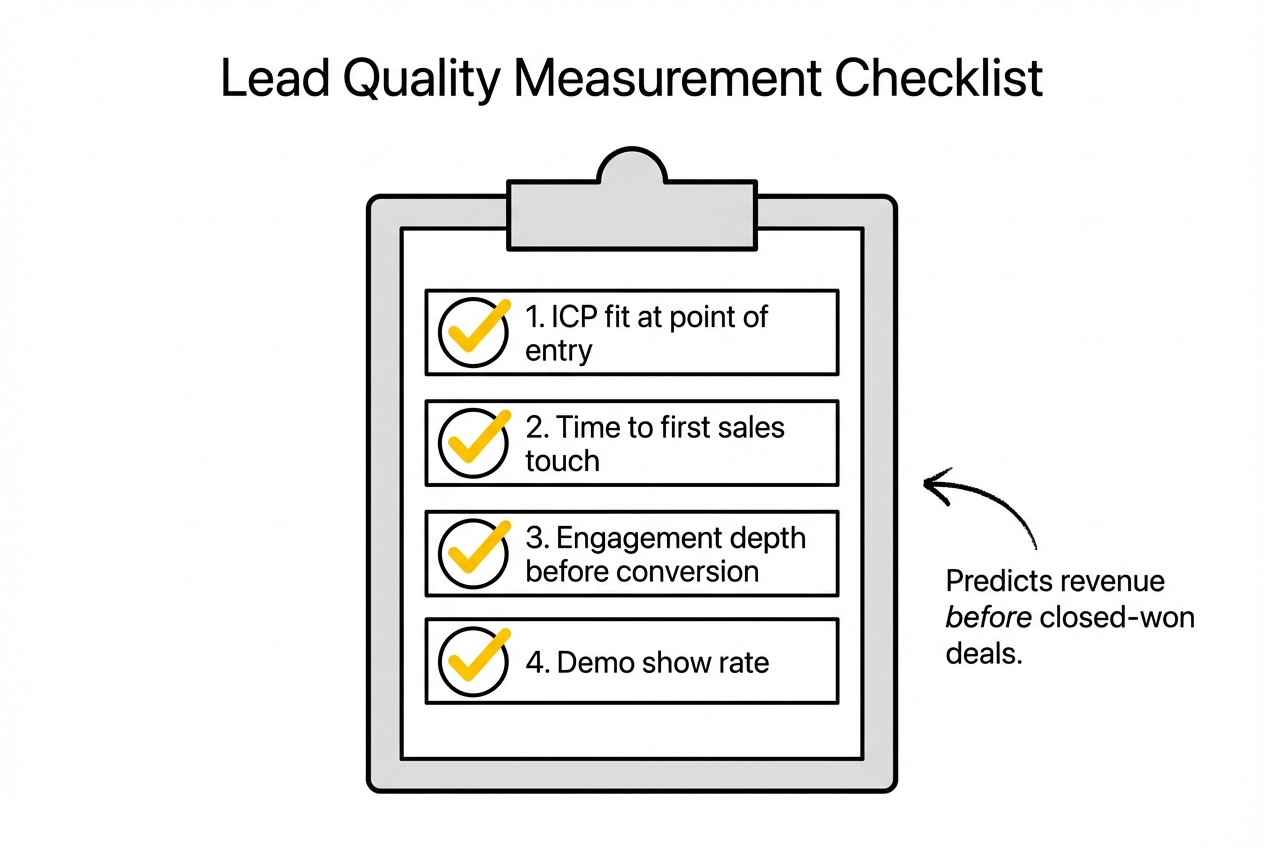
Some of the most useful early-funnel signals for lead quality in SaaS PPC:
- ICP fit at point of entry. Company size, vertical, and job title captured at form submission and cross-referenced against your ideal customer profile. A lead from a 10-person startup may have the same CPL as one from a 200-person Series B company, but very different expected revenue. Flag ICP fit as a lead property in your CRM the moment a lead is created.
- Time to first sales touch. Leads contacted within five minutes are substantially more likely to convert. More usefully, how quickly your sales team prioritises a lead tells you something about perceived quality. If SDRs are skipping inbound leads from certain campaigns, that is a signal worth investigating.
- Engagement depth before conversion. Leads that visited your pricing page, viewed a comparison page, or returned to your site multiple times before submitting a form tend to convert downstream at higher rates. Track this at the CRM level so it informs lead scoring, not just session data in your analytics platform.
- Demo show rate. The percentage of booked demos that actually happen is a fast, reliable proxy for pipeline seriousness. A campaign that books demos at a 40% show rate is producing different quality to one booking at 60%, even if CPL is identical.
None of these signals requires complex implementation. Most CRMs can capture and surface them within a standard setup. The key is reporting on them alongside your PPC metrics, not in a separate sales dashboard that marketing never sees.
CRM Stage Alignment for Lead Quality: Connecting Paid Media to Pipeline
The structural problem in most SaaS marketing teams is that PPC performance lives in Google Ads or a reporting layer on top of it, while pipeline lives in HubSpot or Salesforce. The two worlds rarely talk to each other in real time.
CRM stage alignment for lead quality means deliberately mapping your pipeline stages to your PPC reporting, so you can see how leads from specific campaigns, ad groups, or keywords progress through the funnel.
The mechanics work like this. When a lead submits a form, the GCLID (Google Click ID) is captured and stored against that contact in your CRM. As the lead progresses through pipeline stages, those stage changes are uploaded back to Google Ads as offline conversion events. Google Ads then knows which clicks and queries are producing qualified pipeline, and the bidding algorithm adjusts accordingly.
This is not a new capability. Google’s own documentation recommends creating a separate conversion action for each meaningful pipeline stage. The more sophisticated implementation assigns values to each stage based on its likelihood of generating revenue. A demo booking might carry a value of £100, a qualified opportunity £500, and a closed deal the full contract value.
What makes this approach powerful is that it closes the feedback loop between what the ad platform sees and what actually matters to the business. Instead of asking Google to optimise for form fills, you are showing it which form fills became real customers. Over time, the algorithm shifts spend toward the queries and audiences that produce qualified pipeline.
For this to work reliably, a few things need to be in place. GCLID capture must be consistent across your forms, because any lead without a stored click ID cannot be attributed. CRM data hygiene matters: a lead stuck in the wrong pipeline stage, or one that was never moved through your CRM properly, introduces noise. And the upload frequency needs to be at least daily to keep Smart Bidding responsive. Automating the CRM-to-Google sync via HubSpot’s native integration or tools like Make is more reliable than manual CSV exports, which tend to degrade as a process over time.
It is worth noting that Smart Bidding requires a minimum of 30 to 50 conversions per month per campaign to function effectively. For accounts spending below that volume threshold, weighted conversion values help aggregate signal across stages so the algorithm still has enough data to learn from.
.jpeg)
Building a Weighted Pipeline Approach in SaaS PPC
Not every lead that clears your MQL threshold has equal expected value. A weighted pipeline approach acknowledges this by assigning revenue-adjusted values to leads at different stages, then using those values to calculate a real-time pipeline contribution from your PPC campaigns.
The calculation is straightforward. For each pipeline stage, you need two numbers: the average deal size for deals that reach that stage, and the historical close rate from that stage to closed-won. Multiplied together, they give you an expected revenue value for each lead in that stage.
For example, if your average ACV is £40,000 and your historical close rate from demo to closed-won is 20%, a lead in demo stage carries an expected value of £8,000. A lead at SQL stage with a 35% close rate to demo carries a further-discounted expected value of approximately £2,800.
Aggregated across your active pipeline, this gives you a weighted pipeline figure that reflects current PPC contribution without waiting for deals to close. It is a directional number, not a precise forecast. But for the purpose of evaluating whether your paid campaigns are producing commercially valuable leads, it is far more meaningful than MQL volume or CPL in isolation.
The weighted pipeline approach also surfaces problems that aggregate metrics hide. A campaign with low CPL but consistently poor stage progression will show up as a weak contributor to weighted pipeline. A campaign with higher CPL but strong demo-to-opportunity rates will show up as a strong contributor. This is exactly the kind of distinction that matters for high-spend teams deciding where to allocate budget.
For this to work, you need your CRM data to be reasonably current. Stale deals stuck in incorrect stages will distort the calculation. A monthly or fortnightly review of pipeline data hygiene is worth the operational overhead.
Sales Feedback Loops in SaaS Marketing
Data from your CRM tells you what happened to a lead. Feedback from your sales team tells you why.
Sales feedback loops in SaaS marketing are structured processes for capturing SDR and AE observations about inbound lead quality and routing them back to the marketing team in a form that influences campaign decisions. Done well, they surface intent signals, objection patterns, and competitive context that no attribution model can provide.
The practical implementation does not need to be sophisticated. At minimum, a weekly or fortnightly review where sales shares observations about inbound lead quality from specific campaigns or keyword themes gives marketing the context to make better decisions. A Slack channel or CRM property where SDRs can tag lead quality in real time is more scalable and less dependent on scheduled conversations.
What you are looking for is patterns, not individual data points. If SDRs consistently report that leads from competitor keyword campaigns come in with unrealistic expectations about pricing or switching effort, that is useful signal for how you write ad copy and landing page messaging for those terms. If demo no-show rates are elevated for leads from a specific campaign, that might indicate a mismatch between the ad promise and the actual offer.
Chris Walker and the Refine Labs team have written extensively about the attribution mirage problem in B2B SaaS: the idea that the signals marketing can easily measure are often the weakest indicators of actual buyer intent. Sales feedback loops are one way to surface the stronger signals that do not show up in platform data. The full picture requires both.
Intent Segmentation: Separating Junk Leads From Qualified Prospects
Not all paid traffic is trying to buy your product. In SaaS PPC, a significant portion of search volume on category keywords comes from people who are researching, comparing, building something themselves, or simply curious. Treating all of this traffic as equivalent in your lead quality measurement will distort every downstream metric.
Intent segmentation is the practice of structuring your campaigns, landing pages, and lead capture in a way that separates high-intent from low-intent visitors before they become leads.
Some useful approaches for our analytics hub covers further approaches for demand gen teams:
- Progressive qualification in forms. Asking one or two qualifying questions (company size, primary use case, current solution) at the form stage filters out low-intent submissions before they enter your CRM. The trade-off is some reduction in form conversion rate. The benefit is that every lead that does submit has cleared a higher bar, and your downstream conversion metrics become more meaningful.
- Campaign-level intent mapping. Branded keywords, competitor keywords, category keywords, and problem-aware keywords all carry different average intent levels. Reporting lead quality separately for each campaign type, rather than in a blended average, gives you a more accurate read of where your qualified pipeline is actually coming from.
- Exclusion audiences. Students, job seekers, and current customers are high-volume segments that consume budget and inflate lead counts without contributing to qualified pipeline. Building and maintaining exclusion lists for these segments is basic hygiene in a well-run SaaS PPC account.
The goal of intent segmentation is not to reduce lead volume for its own sake. It is to ensure that the leads you are measuring against are leads that could plausibly become customers, so that your quality metrics are tracking something real.
Reporting Lead Quality Without Waiting Six Months
The practical objection to everything above is the timeline. Closed-won data takes months to accumulate. Sales feedback loops require regular operational effort. CRM integrations take time to build and validate.
The framing to use internally is this: you are building a leading-indicator framework, not replacing your lagging-indicator reporting. MQL-to-SQL rate, demo show rate, and ICP fit score are available within days of a campaign launch. Weighted pipeline contribution is available within weeks. Closed-won attribution takes months but remains the ground truth against which your leading indicators are calibrated. Building a Scale-Ready SaaS PPC Engine After PMF: From Ad-Hoc to Operating System, also on this blog, takes this further.
Practically, this means structuring your PPC reporting in layers:
- Weekly: Platform metrics (CPL, conversion volume, impression share), plus demo show rate and ICP fit by campaign.
- Monthly: MQL-to-SQL by campaign, weighted pipeline contribution, stage-by-stage progression for cohorts from the prior month.
- Quarterly: Closed-won attribution by campaign or keyword theme, CAC payback by acquisition source, recalibration of conversion values against actual deal data.
The weekly and monthly layers give you enough signal to make directional bidding and budget decisions without waiting for the quarterly cycle. The quarterly layer is where you check whether your leading indicators are still predictive and adjust your weighting model if they are not.
This is not a perfect measurement system. Attribution in B2B SaaS with long sales cycles and multi-touch buying processes will never be perfectly clean. But consistent, directional reporting built on the right leading indicators is far more useful than waiting six months for data that arrives too late to act on.
.jpeg)
Frequently Asked Questions
What is a good lead to MQL conversion rate in SaaS?
The cross-industry average is around 31%, but B2B SaaS tends to outperform this with a 36 to 41% range depending on channel mix. PPC-sourced leads in SaaS convert to MQL at approximately 36%, lower than SEO (41%) or email (43%). Blended averages are less useful than channel-specific benchmarks; a PPC-heavy acquisition mix will naturally produce a lower blended rate than one weighted toward organic or referral.
How can I effectively measure marketing qualified leads in PPC campaigns?
Start by ensuring your MQL definition is agreed between marketing and sales, then track MQL-to-SQL progression by campaign, not in aggregate. Capture GCLID data on every lead and use offline conversion uploads to bring CRM stage data back into Google Ads. This gives you visibility into which campaigns are producing leads that sales actually engages with, rather than just which campaigns are producing the most form fills.
What are the key metrics to evaluate lead quality in SaaS PPC?
The most useful metrics are MQL-to-SQL rate by campaign, demo show rate, ICP fit score at entry, time-to-first-touch, and weighted pipeline value contributed per campaign. CPL and MQL volume are useful context but should not be the primary quality indicators. Cost per SQL or cost per qualified opportunity is a more reliable headline metric for high-spend teams.
How can early-funnel signals impact lead quality assessment?
Early-funnel signals like ICP fit, engagement depth before conversion, and demo show rate give you a read on lead quality within days of a campaign launch, rather than waiting months for closed-won data. They are leading indicators, not ground truth, but they are strongly correlated with downstream conversion rates in most SaaS funnels. Reporting on them alongside CPL gives you enough signal to make meaningful budget and bidding decisions in the short term.
What role does CRM stage alignment play in measuring lead quality?
CRM stage alignment connects your PPC campaigns to pipeline progression data. By storing GCLIDs in your CRM and uploading stage changes back to Google Ads as offline conversions, you give the bidding algorithm visibility into which clicks produced qualified pipeline rather than just form fills. This shifts optimisation from proxy metrics to commercially meaningful outcomes.
How can sales feedback loops enhance the evaluation of lead quality?
Sales feedback gives you qualitative signal that attribution models cannot. SDR observations about lead intent, competitive context, and expectations from specific campaign types surface patterns that raw conversion data does not capture. Structured weekly feedback between sales and marketing, combined with CRM tagging for lead quality, helps identify mismatches between ad messaging and actual buyer intent before they become expensive pipeline problems.
What is a weighted pipeline approach and how does it help in assessing lead quality?
A weighted pipeline approach assigns expected revenue values to leads at each pipeline stage, based on historical close rates and average deal size. Aggregating these values gives you a real-time estimate of PPC pipeline contribution without waiting for deals to close. It is a directional number rather than a precise forecast, but it is substantially more meaningful than MQL count or CPL when evaluating which campaigns are driving commercial value.
How can high-spend teams streamline their lead quality assessment processes?
Prioritise CRM-to-ad platform integration, automate the offline conversion upload process rather than relying on manual exports, and build a layered reporting structure with weekly leading indicators and monthly pipeline progression data. The operational overhead of maintaining this infrastructure is lower than the cost of making budget decisions on CPL data alone. For teams spending at meaningful scale, the signal from a properly configured offline conversion setup typically improves pipeline quality within 60 to 90 days.
What actionable insights can improve data integrity in lead measurement?
Three things have the most impact: aligning MQL definitions between marketing and sales so the metric is tracking a consistent standard, ensuring GCLID capture is consistent across all form submissions, and auditing CRM pipeline data regularly for stale or incorrectly staged leads. Bad data upstream of your reporting layer makes every downstream metric unreliable.
How can I transition from MQLs to revenue without lengthy wait times?
Build a leading-indicator framework that gives you weekly and monthly signal without requiring closed-won data. Demo show rate, ICP fit, and MQL-to-SQL progression by campaign are available within days to weeks of a campaign launch. Use these to make directional decisions while your longer attribution cycle accumulates. Quarterly, recalibrate your leading indicators against actual closed-won data to check they are still predictive.
If this is something your team is working through, we regularly help SaaS marketing operations teams build measurement infrastructure that holds up in board meetings. Worth a conversation if the gap between your platform metrics and pipeline data is becoming a problem.