Proving Pipeline, Not Clicks: Reporting SaaS PPC to the C-Suite
Report SaaS PPC to the C-suite with pipeline-first KPIs, leading indicators and attribution guardrails—so you prove revenue, not clicks.

You launch campaigns. Demos come in. Platform metrics look healthy. Three months later, the board asks where the pipeline is. And you're showing them a CTR chart.
This is the gap that kills trust in PPC. Not the results themselves. The way they're reported.
Most SaaS PPC reporting is built around what's easiest to export from Google Ads: impressions, clicks, cost-per-click, conversion rate. These metrics are useful for optimising campaigns. They're largely useless for justifying budget to a CFO or CEO.
The C-suite cares about three things: is paid media generating qualified pipeline, are we doing it efficiently, and what are the risks to that continuing. The B2B SaaS marketing metrics that answer those questions are very different from the ones Google Ads exports by default. Everything else is noise.
This article is a practical guide to building SaaS PPC reporting that answers those three questions: the KPI stack to use, the leading indicators that actually predict pipeline quality, the guardrails that stop attribution arguments before they start, and a reporting cadence that keeps each level of the business looking at the right view.
Why "Clicks/Leads" Reporting Fails in B2B SaaS
The problem isn't that platform metrics are wrong. It's that they're measuring something different from what the C-suite is trying to understand.
When a CEO sees cost-per-click trending down, they have no idea whether that means more revenue is coming. When a CFO sees "523 conversions this month," they don't know if sales is actioning any of them, what those conversions represent in pipeline, or whether the number will translate into closed revenue 90 days from now.
The disconnect is structural. B2B SaaS buying cycles are long, often 60 to 180 days, from first click to closed-won, and buying committees mean a single ad click rarely closes a deal directly. Reporting that treats conversions as outcomes, rather than inputs to a pipeline, misrepresents how the business actually works.
There's also a specific credibility trap: when MQL volume goes up but pipeline stays flat, it looks like marketing is spinning its wheels. The C-suite notices that gap. If you haven't built a pipeline-quality lens into your reporting, you'll have no credible explanation for it.
The fix isn't complicated. It's a different set of metrics, reported in a different order, with explicit acknowledgement of where time lags and attribution limits apply.
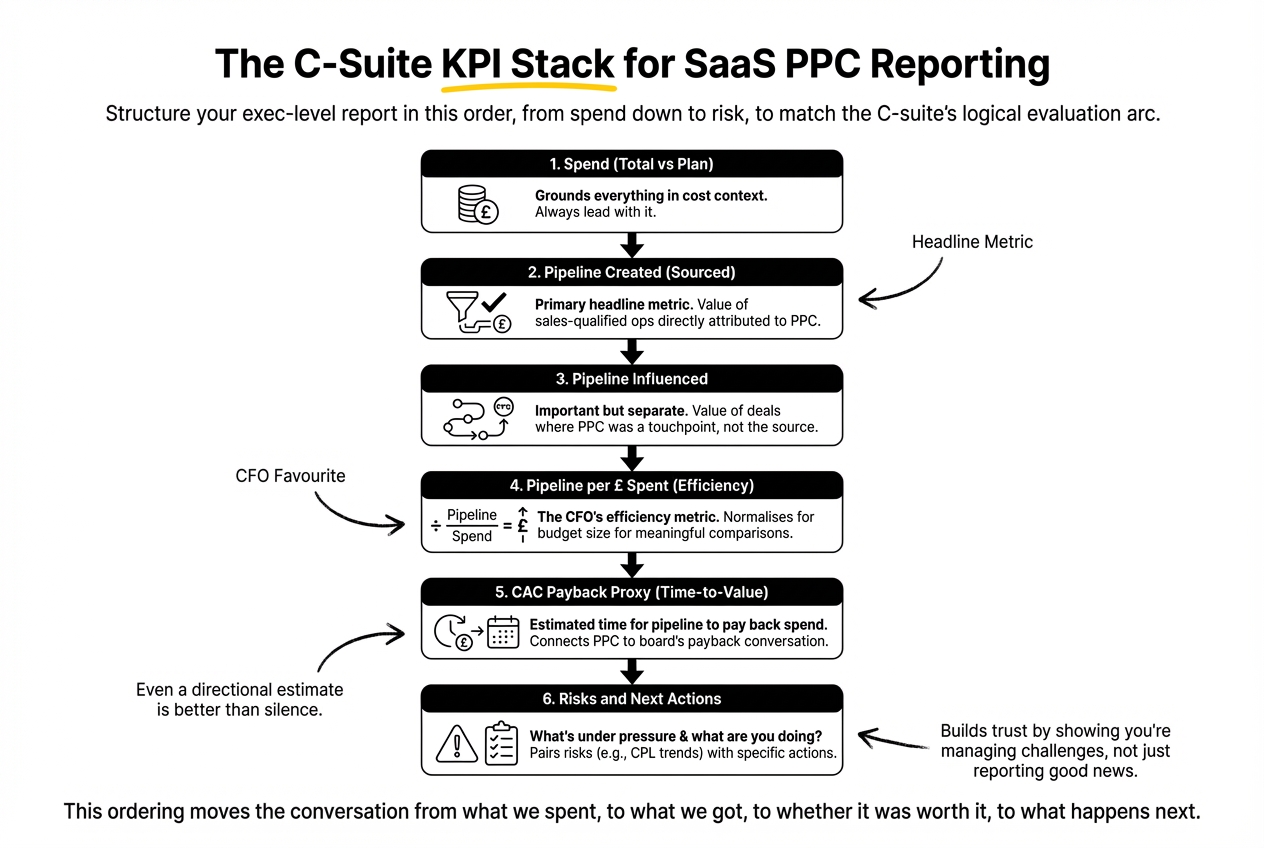
The C-Suite KPI Stack for SaaS PPC Reporting
The KPI stack is the core of any exec-level PPC report. Structure it in this order, from spend down to risk:
1. Spend
Total PPC spend for the period, versus plan. Simple. But always lead with it, as it grounds everything else in a cost context.
2. Pipeline created (sourced)
The value of sales-qualified opportunities directly attributed to PPC as first touch or dominant touch, within the agreed attribution window. This is your primary headline metric.
3. Pipeline influenced
The value of deals where PPC appeared in the path but wasn't the sourcing channel. Important to include, but always separate from sourced. Conflating them is how attribution credibility breaks down.
4. Pipeline per £ spent
Total sourced pipeline divided by total spend. This is the efficiency metric that CFOs actually care about. It normalises for budget size and makes month-on-month comparisons meaningful regardless of whether spend changed.
5. CAC payback proxy
If you have enough CRM data to pull average deal sizes and close rates, you can estimate how long it takes the pipeline created this period to pay back the spend that generated it. This connects PPC directly to the payback period conversation that dominates SaaS board meetings. Even a directional estimate is worth more than a silence where this number should be.
6. Risks and next actions
What's under pressure and what are you doing about it? A report that only shows good news is a report no one trusts. Flag CPL trends, conversion rate movements, or pipeline coverage gaps. Pair each risk with a specific action.
This ordering matters. It moves the conversation from what we spent, to what we got, to whether it was worth it, to what happens next. That's the logical arc a C-suite executive follows when evaluating any investment.
Leading Indicators: What to Track Before Deals Close
The challenge with long B2B sales cycles is that the most important outcomes (closed-won revenue, CAC payback) aren't visible for months after the spend. Reporting that only shows lagged outcomes is always going to lag the conversation your leadership is having about current performance.
Leading indicators bridge that gap. They're earlier-stage signals that correlate with pipeline quality, even before deals progress.
The most reliable ones for B2B SaaS PPC are:
- High-intent conversion mix. What percentage of your PPC conversions are demo requests or direct sales contact, versus content downloads or newsletter signups? A shift in this mix, even at stable total conversion volume, is an early signal of quality change.
- Meeting-booked rate. Of the demos that come through PPC, what proportion result in a discovery call being scheduled? This is the first downstream quality check, and sales teams can usually pull it within a week of leads entering the CRM.
- SQL rate from PPC. What percentage of PPC-generated leads are accepted by sales as sales-qualified? This is the most direct measure of lead quality the C-suite will understand. Industry benchmarks suggest MQL-to-SQL conversion in B2B SaaS averages 15–21%; if your PPC SQL rate is materially below that baseline, it warrants explanation.
- Opportunity creation rate. Of SQLs, what percentage progress to formal opportunity stage? This narrows the quality lens further, and is typically where content-driven leads and intent-driven leads separate clearly.
- Median time-to-SQL. If this number is increasing, it could indicate worsening lead quality, slower sales follow-up, or both. Either way, it’s actionable.
- Stage progression velocity. Are open PPC-sourced opportunities moving forward, stalling, or being disqualified? Disqualification reasons are particularly valuable: they’re direct feedback from sales on what’s wrong upstream.
None of these metrics require perfect attribution. They just require a CRM that's connected to your ad platform, consistent lifecycle stage definitions, and a RevOps team (or process) that captures lead source at intake. How to Build a SaaS PPC Engine for B2B SaaS (Not Just Run Ads), also on this blog, takes this further.
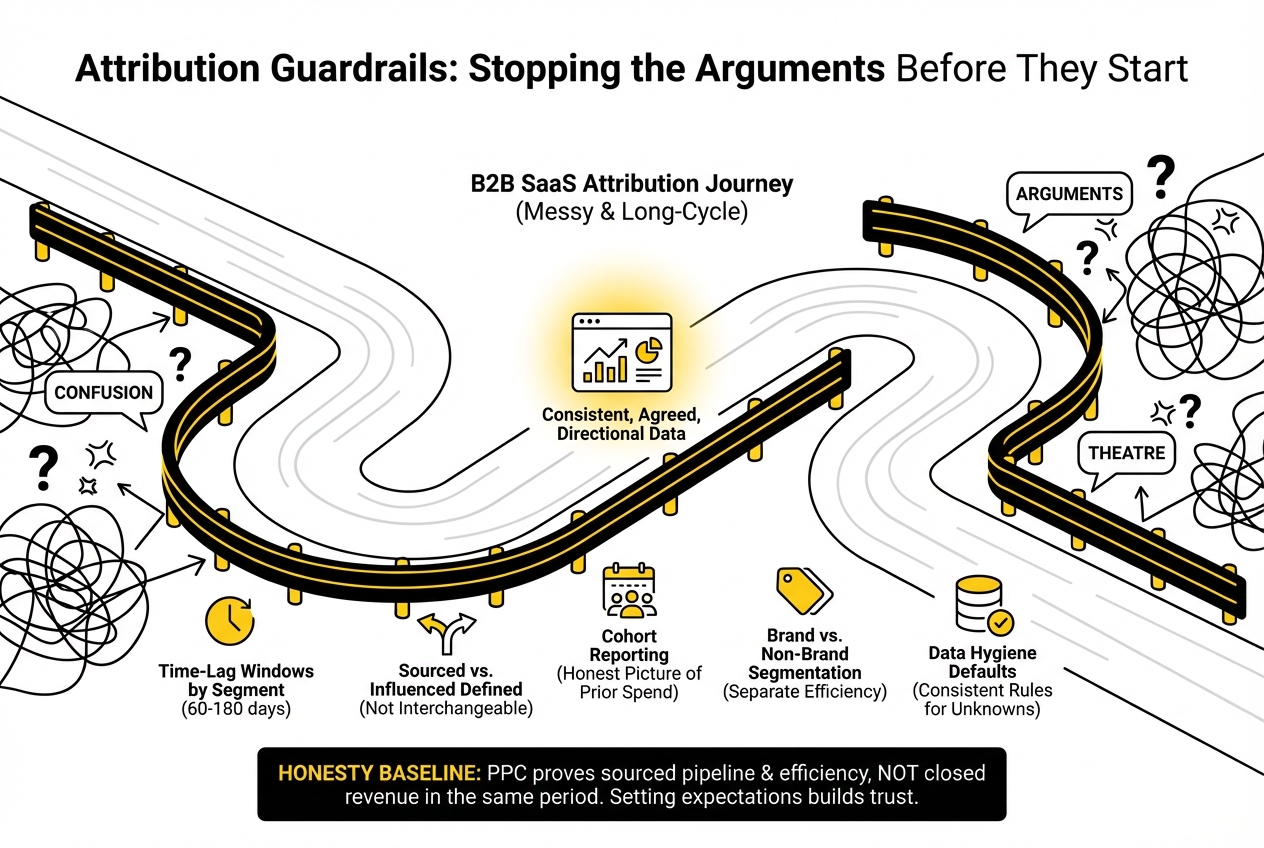
Attribution Guardrails: Stopping the Arguments Before They Start
PPC attribution in B2B SaaS is messy. That's not a solvable problem. It's a structural feature of multi-touch, long-cycle buying. The goal isn't perfect attribution. It's consistent, agreed, directional data that everyone interprets the same way.
The most common source of exec-level attribution arguments isn't that the data is wrong. It's that the definitions aren't agreed upfront. "What counts as a PPC lead?" is a question that shouldn't be answered in the middle of a board meeting.
Agree these guardrails before your first exec report goes out:
Time-lag windows by segment. Sales cycle lag reporting is one of the most underused tools in executive PPC conversations. Mid-market deals might close in 60–90 days; enterprise in 150–180. Define a standard attribution window per segment and document it. When revenue looks thin in a given period, you can point to the lag window rather than defending the spend.
Sourced vs. influenced, defined clearly. Sourced means PPC was the first meaningful touch before the lead entered the CRM. Influenced means PPC appeared in the journey but wasn't first touch. Both have value. They are not interchangeable, and adding them together to create a headline pipeline number is attribution theatre.
Cohort reporting. Instead of looking at pipeline in the same period as spend, report on cohorts: "of the leads generated in Q3, here's the pipeline status as of today." This gives you an honest picture of what prior spend actually delivered, without the distortion of time-lag.
Brand vs. non-brand segmentation. Brand PPC conversions will almost always look more efficient than non-brand. If your reporting doesn't separate them, your non-brand efficiency looks better than it is, and the next budget cut will target the wrong things.
Data hygiene defaults. What happens when lead source is missing in the CRM? Decide in advance. Most teams attribute unknowns to organic or direct, which systematically undervalues PPC. Create a rule and apply it consistently.
One more thing: be honest about what PPC can prove and what it can only indicate. PPC can credibly show sourced pipeline, efficiency per pound spent, and leading indicators of quality. It cannot credibly claim closed revenue in the same period the spend happened, or show full influence across every touchpoint in a long buying cycle. Setting those expectations upfront is not weakness. It's what builds exec trust over time.
What Not to Show the Board
Knowing what to leave out is as important as knowing what to include.
Unless specifically asked, exclude these from exec-level reporting:
- CTR performance. The C-suite has no frame of reference for whether 3.4% CTR is good or bad for your category. It adds noise without context.
- Impression share. A vanity metric in most B2B contexts. It tells you how often you appeared; it tells you nothing about whether appearances led anywhere useful.
- Platform ROAS. If your revenue attribution is partial or lagged (and it is), platform-reported ROAS is inflated and will be challenged. Report pipeline efficiency instead.
- Cost-per-click trends in isolation. Lower CPC might mean you’re getting more efficient or it might mean you’ve moved to lower-intent keywords. Without context, it misleads.
These metrics belong in your operator-level reporting, where they're used to make tactical decisions. They don't belong in a board readout.
Building a Minimal Viable Single Source of Truth
You don't need a complex data stack to report PPC in pipeline terms. You need three things connected correctly.
Google Ads to CRM (HubSpot or Salesforce) via offline conversions or UTM-based tracking. Lead source must be captured at the point of form submission or meeting booking, and it must flow into the CRM field that sales can see. This is the single most important technical step. Without it, you're reporting by feel. For a practical guide to setting this up correctly, Analytics for B2B SaaS, What to Track Before You Spend £1 covers the setup in detail.
Consistent lifecycle stage definitions. MQL, SQL, and opportunity need to mean the same thing to sales and marketing. When they don't, your SQL rate numbers are meaningless because sales and marketing are counting different things.
A RevOps feedback loop. This could be a RevOps function, a senior marketer, or a weekly sync between the paid media lead and an AE. Someone needs to be looking at disqualification reasons and surfacing them upstream. Without that loop, PPC optimisation is flying blind on quality.
If you're thinking about this from an efficiency angle and want to put a number on what it's costing you, CPA: The Critical PPC Metric for Scaling SaaS PPC provides a framework for understanding cost-per-acquisition in the context of downstream value.
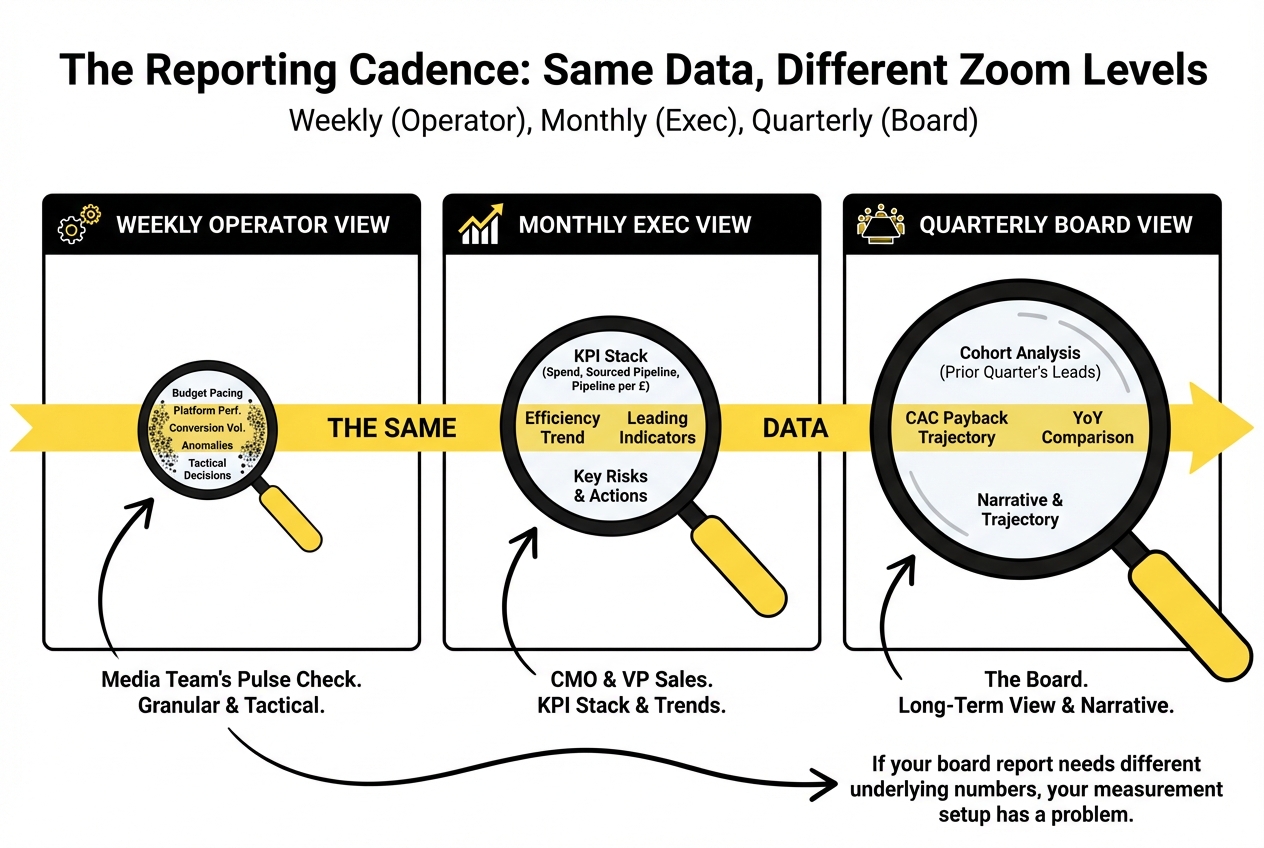
The Reporting Cadence: Weekly, Monthly, Quarterly
The same data, viewed at different zoom levels, serves different audiences and different questions.
Weekly operator view: this is the media team's internal pulse check. Platform performance, budget pacing, conversion volume, any anomalies. Not exec-facing. Granular. Used to make tactical decisions before a bad week compounds into a bad month.
Monthly exec view: what goes to the CMO and VP Sales. The KPI stack (spend, sourced pipeline, pipeline per £, efficiency trend). Leading indicators for the current cohort. One to two risks with associated actions. No platform metrics unless they're used to explain a specific movement. Aim for a single slide or a short dashboard that can be reviewed in under five minutes.
Quarterly board view: same structure as the monthly exec view, but zoomed out to the quarter and compared against the same quarter last year where applicable. This is also where cohort analysis is most useful: show the pipeline status of each prior quarter's leads, and use it to talk about CAC payback trajectory. The narrative matters here more than the data: what changed, why, what you expect next.
The principle is the same data at different zoom levels. If your board report needs different underlying numbers from your weekly report, your measurement setup has a problem.
The Narrative Layer
Experienced executives don't read dashboards. They read narratives.
Every PPC report, at every cadence, should have a brief written summary that answers four questions: What happened this period? Why did it happen? What are we doing about it? What do we need from other teams?
That last question is often skipped. If pipeline progression is slow, it might be because sales follow-up is lagging. The CMO report is the right place to surface it, because that's who can do something about it. PPC reporting that only covers what the media team controls will always look incomplete to an exec audience.
The narrative is also where you manage expectations around time lags. "The spend increase from last month is not yet visible in pipeline because it falls outside the 90-day attribution window. We expect it to appear in next month's cohort view" is a sentence that prevents a difficult question in a board meeting.
Frequently Asked Questions
What should a C-suite PPC report include (and what should be left out)?
Include: total spend, sourced pipeline, pipeline per £ spent, a CAC payback proxy if available, two to three leading indicators, and explicit risks with next actions. Leave out: CTR, impression share, platform ROAS, and cost-per-click unless used to explain a specific trend. The exec report should answer whether PPC is generating qualified pipeline efficiently, not log platform activity.
How do you report PPC impact when the sales cycle is long and revenue lags 60–180 days?
Use cohort reporting: track the pipeline status of leads sourced in a given period over time, rather than trying to match spend and revenue in the same window. Pair this with leading indicators (SQL rate, meeting rate, opportunity creation) that give earlier signal on quality without waiting for deals to close.
What's the best way to separate sourced vs influenced pipeline in PPC reporting?
Define the terms clearly before you start reporting. Sourced means PPC was first touch before CRM entry. Influenced means PPC appeared in the journey but wasn't the originating touch. Report both, always in separate rows. Never combine them into a single pipeline headline, as it inflates the apparent contribution and will be challenged when someone looks closely.
Which PPC metrics matter to a CFO, not a media buyer?
Pipeline per £ spent, sourced pipeline as a percentage of total pipeline, CAC payback proxy, and SQL rate from PPC. A CFO's frame of reference is capital efficiency: are we spending the right amount to generate the right return, and how long does it take to get it back. Every metric in a CFO-facing report should connect to that question.
What are the most credible leading indicators of PPC pipeline quality?
Meeting-booked rate, SQL rate from PPC, opportunity creation rate, and median time-to-SQL. These are downstream enough to show genuine quality signal, but early enough that you can act on them before pipeline gaps become revenue gaps. Disqualification reasons from sales are arguably the most useful of all: they tell you exactly what's wrong.
How do you avoid "attribution theatre" while still showing PPC value?
Set agreed definitions upfront (sourced vs influenced, attribution windows, brand vs non-brand). Be explicit about what PPC can prove (sourced pipeline, efficiency) and what it can only indicate. Avoid combining metrics to create inflated headline numbers. Consistent, honest reporting builds more C-suite trust over time than any optimistic number you'll have to defend later.
How often should PPC be reported to execs, and what changes by cadence?
Weekly reports are internal operator documents, not exec-facing. Monthly exec reports show the KPI stack with one narrative paragraph. Quarterly board views zoom out to cohort performance, CAC payback trajectory, and pipeline contribution by segment. The zoom level changes; the underlying metrics stay consistent.
What does a one-slide PPC update look like for board or CEO readouts?
Five rows: Spend (actual vs plan) | Sourced pipeline | Pipeline per £ spent | SQL rate | Top risk and action. One paragraph below the table covering what changed, why, and what's being done. That's it. If you're tempted to add more, the instinct is usually to cover for something rather than communicate something.
If your reporting sits somewhere between "platform export" and "properly connected to pipeline," this is usually the right time to look at your measurement setup end to end. We run this kind of audit with SaaS teams regularly. You can find out more about what we cover at Upraw Media's analytics and measurement service.

.png)
