Transforming SaaS PPC Data into Executive Decision Points
A method for turning SaaS PPC activity logs into executive decision points: what to log, how to triage decisions, risks and context, and how to write them for the board.

The monthly paid media report runs to fourteen slides. It lists forty-odd changes, a dozen charts and a confident summary of what improved. The CFO reads it, nods, and asks one question: “So what do you need from us?”
Most PPC reporting can’t answer that, because it’s built to show what happened rather than to ask for anything. Yet the raw material for a better answer already exists. Every PPC programme generates a running record of what was changed, when and why. Transforming SaaS PPC activity logs into key executive insights means treating that record as the starting point for decisions, not as an appendix nobody reads.
This article sets out a method for doing it. It covers what a decision-ready activity log needs to capture, how to triage it into decisions, risks and context, and how to write executive decision points that a board can act on. It also covers how to handle attribution, long sales cycles and the brand versus performance tension along the way.
What Activity Logs and Decision Points Are
A PPC activity log is a record of every material change to a paid media programme: budgets, bidding, targeting, creative, landing pages and tracking. Each entry records the date, the owner, the reason for the change and its expected effect.
An executive decision point is a specific choice that leadership needs to make. It comes with the options, a recommendation, the evidence behind it, the risks either way and a deadline.
The link between the two is the method in this article. Converting SaaS PPC activity logs into strategic decision-making points works because the log already contains the most important context executives lack: why things changed. Performance data shows that cost per opportunity fell. The log explains that it fell because bidding moved to opportunity values in week two. Only the second fact helps anyone decide what to do next.
Why Platform Change History Isn’t Enough
Google Ads keeps its own record of account changes. It shows what changed, who changed it and when. It doesn’t show why, what the change was expected to achieve, or anything that happened outside the platform.
It also doesn’t last. Google Ads change history covers the last two years of account changes. Since June 2026, hourly, daily and weekly reporting data is available for 37 months. A business that relies on the platform’s memory loses the context behind its own past decisions on Google’s schedule.
The bigger gap is everything the platform can’t see. A pricing change, a new sales hire, a CRM migration that broke tracking for nine days, a competitor bidding on your brand: these often explain more about PPC performance than any change in the account. A decision-ready log records them alongside the platform changes.
What a Decision-Ready Activity Log Records
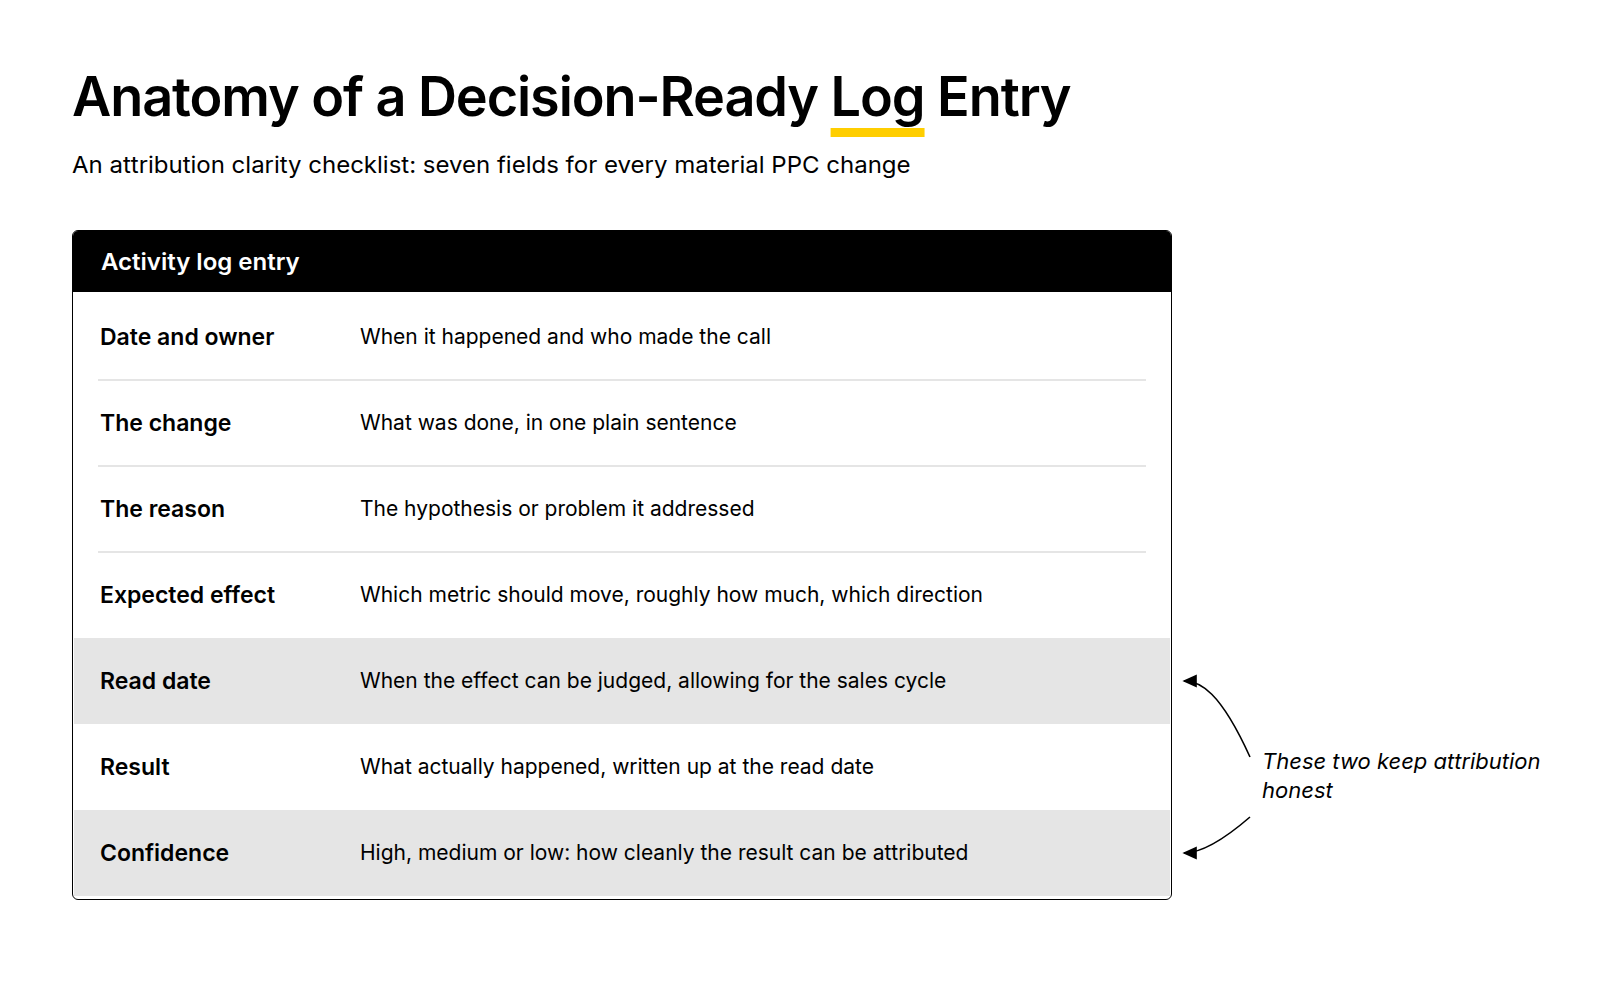
PPC activity logs only become useful for executive decision making if each entry captures more than the change itself. Record these fields for every material change:
- Date and owner: when it happened and who made the call.
- The change: what was done, in one plain sentence.
- The reason: the hypothesis or problem it addressed.
- Expected effect: which metric should move, by roughly how much and in which direction.
- Read date: when the effect can reasonably be judged, allowing for the sales cycle.
- Result: what actually happened, written up at the read date.
- Confidence: high, medium or low, depending on how cleanly the result can be attributed to this change.
Log external events in the same place, using the same fields where they apply. A tracking outage or a pricing change belongs in the log as much as a bid strategy change does.
Keep it simple. A shared spreadsheet or a page in the team’s existing workspace is enough. The discipline matters far more than the tool.
The Method: From Activity Log to Decision Points
Turning PPC data into business insights follows six steps:
- Group the period’s log entries into themes, such as “moved bidding to pipeline values” or “reduced non-brand spend”.
- Read each theme’s result against its expected effect, using only entries that have reached their read date.
- Translate each outcome into business terms: pipeline, cost per opportunity, CAC or payback.
- Classify each theme as a decision, a risk or context.
- Write a decision point for each decision, and a short risk note for each risk.
- Bring no more than three decision points to the executive conversation.
Triage: Decision, Risk or Context
Step four is where most of the value comes from, because it forces a judgement about what leadership actually needs to see.
- Decision: the theme needs something marketing can’t authorise alone. That might be budget beyond the agreed range, a change in another team’s process, or acceptance of a risk above marketing’s tolerance.
- Risk: the theme could move a board-level metric, but no decision is needed yet. Leadership should know about it now so they aren’t surprised later.
- Context: everything else. It stays in the log and the appendix, available to anyone who wants it, but out of the executive summary.
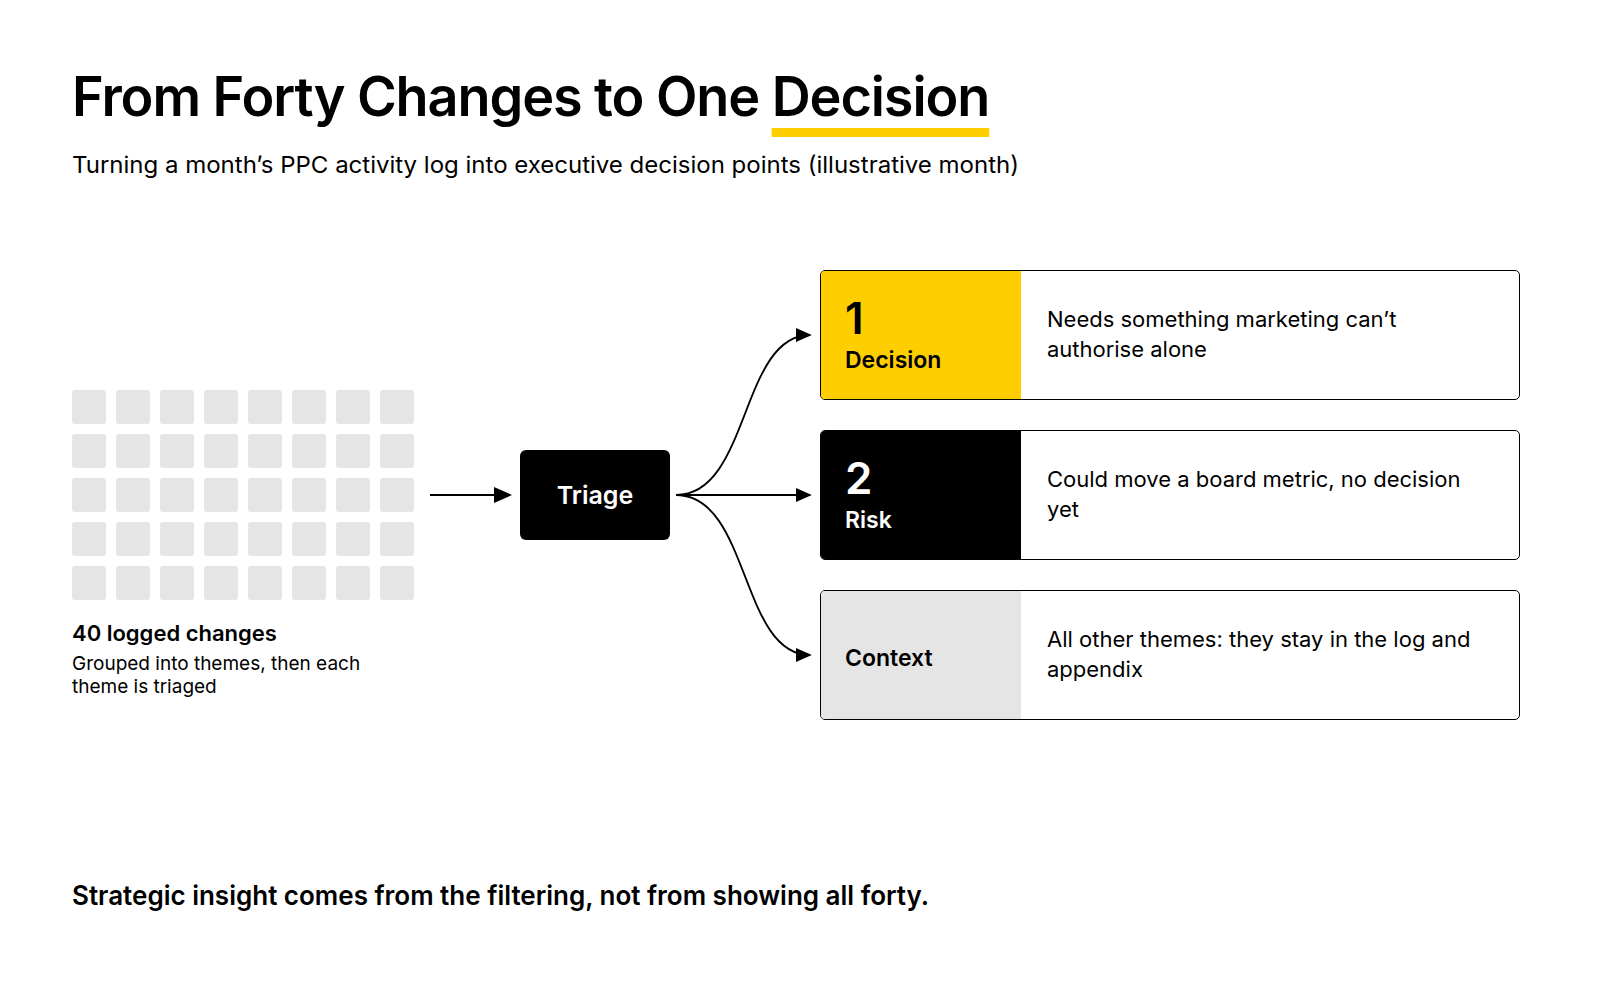
Most themes will be context. That’s the point. A month with forty changes might produce one decision and two risks. Strategic insights for executives come from that filtering, not from showing all forty.
Anatomy of an Executive Decision Point
A decision point has seven parts. Each should fit in a sentence or two:
- The decision: one question, phrased so the answer is a choice.
- Options: two or three realistic choices, including doing nothing.
- Recommendation: which option marketing recommends, and why in one line.
- Evidence: what the activity log and results show, in business terms.
- Risk: what could go wrong with the recommendation, and what happens if nothing changes.
- What we’ll watch: the leading indicator that shows whether the decision is working, and when it can be read.
- Deadline: when the decision needs to be made, tied to a real constraint such as a budget lock.
Consider an illustrative example. In Q2, the activity log shows non-brand, problem-aware search budget was cut by £15,000 a month to fund a move to opportunity-based bidding. By the end of the quarter, cost per opportunity from paid search had improved. But the log also shows branded search volume falling steadily since the cut, with no other change that explains it.
The decision point reads like this:
- Decision: should we restore some of the £15,000 monthly non-brand budget cut in Q2?
- Options: restore it in full, restore £7,500 as a controlled test, or hold at current levels.
- Recommendation: restore £7,500 in a test region, because brand volume may depend on the demand that non-brand spend creates.
- Evidence: cost per opportunity has improved since the cut, but branded search volume has fallen over the same period with no other logged explanation.
- Risk: the test may show no effect, costing up to £22,500 over a quarter. Holding risks a continued fall in brand-sourced pipeline.
- What we’ll watch: branded search volume and brand-sourced opportunities in the test region against the rest, read after eight weeks.
- Deadline: before the Q3 budget lock.
Notice what the decision point doesn’t contain: bid strategy settings, keyword lists or click-through rates. Those live in the log. The decision point contains only what’s needed to choose.
Translating PPC Metrics Into Business Language
SaaS PPC analytics for executives works when every metric arrives already translated. Some useful translations:
- Conversion rate becomes pipeline generated per pound spent.
- Impression share becomes the share of in-market demand you’re currently reaching.
- A bid strategy change becomes what you’ve told the algorithm to optimise for, and what that trades off.
- Cost per lead becomes cost per opportunity, or it doesn’t go in the summary at all.
- A test result becomes the decision it supports, not the uplift percentage.
If a metric can’t be translated into something the CFO cares about, it’s context, not a decision point.
Attribution and Long Sales Cycles
PPC performance measurement in B2B SaaS is never fully certain, and decision points shouldn’t pretend otherwise. Two practices keep them honest.
First, state confidence explicitly. The confidence field from the activity log carries straight through to the evidence line. “Medium confidence: two other changes landed in the same fortnight” is far more useful to a board than false precision.
Second, use the read date. With a four to six month sales cycle, closed-won revenue from this quarter’s changes won’t be visible until next quarter at the earliest. Decision points should rely on leading indicators such as opportunities created or cost per opportunity, and say when the lagging result will be known.
Attribution itself should come from the CRM, with platform data used to explain what the algorithm is doing. For the measurement setup that makes this defensible, see Mastering Board-Defensible SaaS Attribution for Long Buying Journeys.
Balancing Brand and Performance in Decision Points
Performance data is precise and immediate. Brand effects are slow and indirect. Left alone, that asymmetry means performance metrics settle every argument by default, and brand spend gets cut each time budgets tighten.
The activity log helps correct this. When brand or demand creation spend changes, log it with the same rigour as a bid change, including the expected effect and a realistic read date. Then judge brand decision points on brand evidence: branded search volume, direct demo requests and self-reported attribution. The illustrative decision point above is a brand question disguised as a performance one, and the log is what revealed it.
Decision Points in Multi-Stakeholder Environments
Executive decisions in SaaS rarely belong to marketing alone. Budget sits with finance, pipeline targets with sales, pricing with product. Each decision point should name its owner, the person whose approval actually settles it.
Share the activity log beyond marketing. When sales and finance can see what changed and why, decision points arrive with context they already trust, and conversations move faster. In multi-stakeholder environments, the log becomes a shared record rather than a marketing document, which makes it far harder to dispute.
No specialist tool is needed for this. A shared log, a consistent decision point template and a standing slot in the monthly leadership meeting do most of the work.
Risks When Analysing PPC Activity Logs
The method has failure modes worth guarding against:
- Crediting the wrong change. Several changes often land in the same week. Flag overlaps and lower the confidence rating accordingly.
- Reading results too early. Judging a change before its read date usually means judging noise.
- Logging only successes. A log that omits failed changes produces decision points that are systematically too optimistic.
- Ignoring seasonality. Compare against the same period last year, not just the previous month.
- Missing tracking breaks. A broken conversion tag can look like a performance collapse. Log tracking changes and outages.
- Over-claiming precision. Presenting a range is more credible than presenting a single number that later turns out wrong.
The Executive Summary: A Board-Ready Narrative
The output of the method is a one-page summary built for executive decision making, not for completeness:
- One headline: the single most important thing that happened, in business terms.
- Up to three decision points, each in the seven-part format.
- Up to two risks, each in two sentences.
- What changed: five lines at most, summarising the period’s main log themes.
- The full activity log, attached as an appendix for anyone who wants the detail.
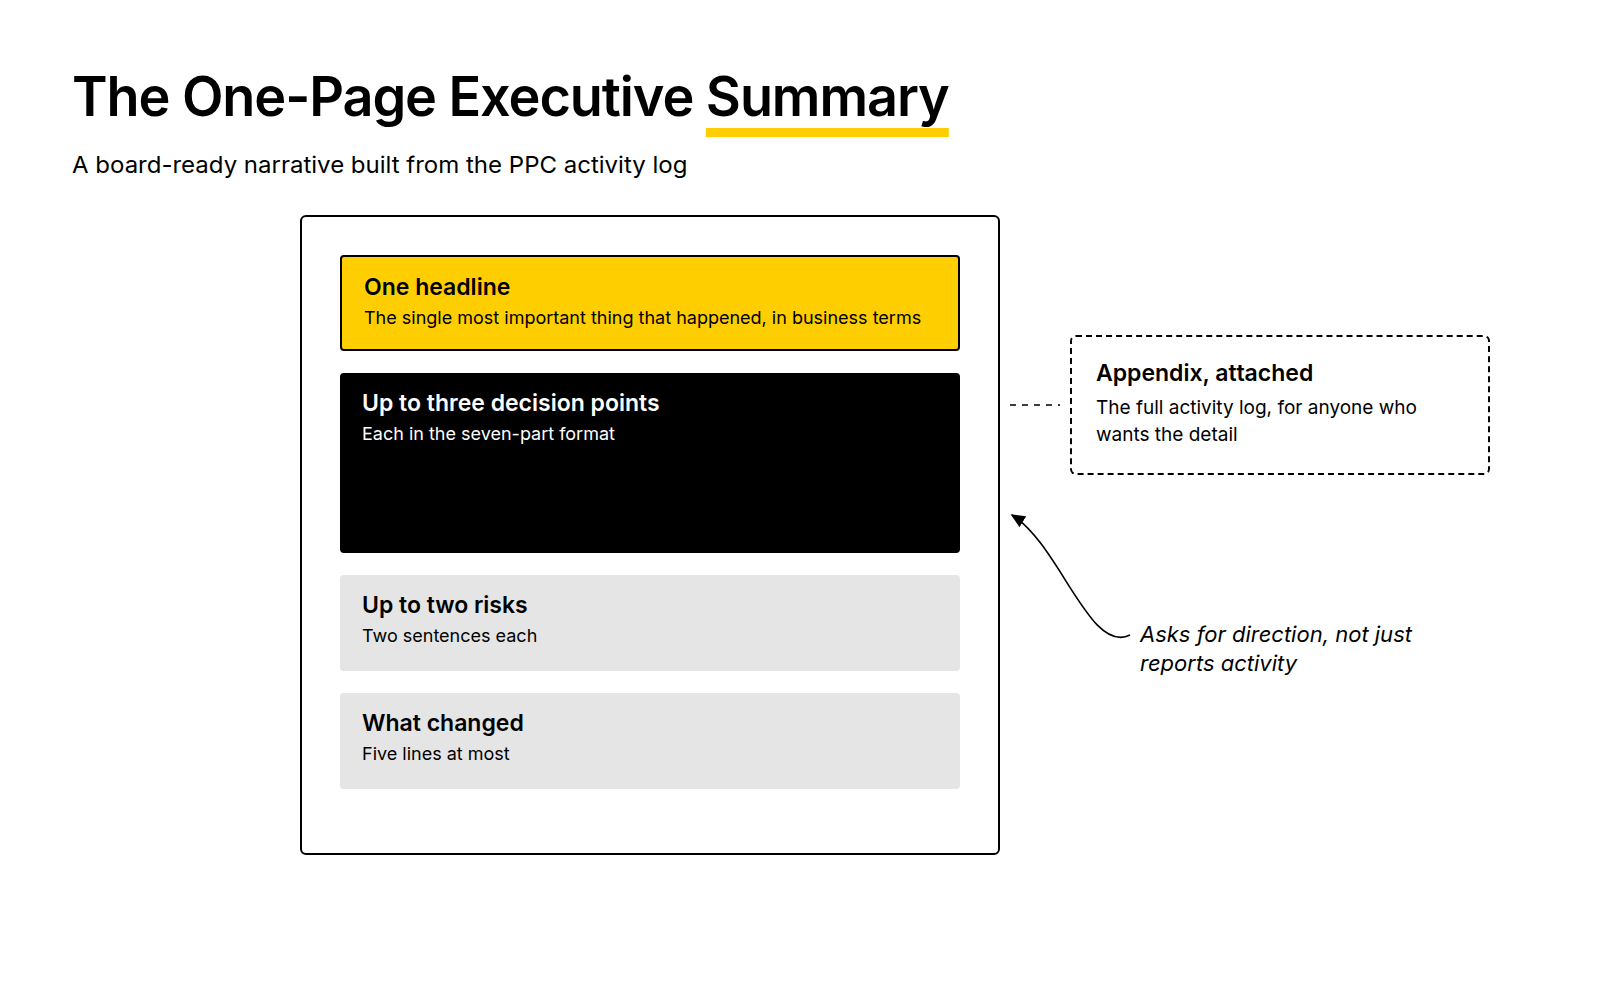
This structure turns PPC reporting from a defence of past activity into a request for direction. That’s what board-ready narratives need to do. For the wider reporting structures this sits inside, see Proving Pipeline, Not Clicks: Reporting SaaS PPC to the C-Suite and Transforming PPC Performance into Strategic Decisions for SaaS. For the metrics to include in board packs, see the Essential Guide to Board-Ready PPC Reporting for SaaS. Monthly reporting itself is the subject of Good Monthly SaaS Paid Media Reports: Recommendations That Matter.
Frequently Asked Questions
How can SaaS PPC activity logs be transformed into actionable insights for executives?
Group the period’s log entries into themes, and read each theme’s result against its expected effect. Translate outcomes into pipeline, cost per opportunity or CAC. Then classify each theme as a decision, a risk or context. Only decisions and risks reach executives, each in a short, structured format with a clear recommendation.
What methodologies can CMOs use to distil complex PPC data into clear recommendations?
Use a decision point format: the decision as a question, two or three options, a recommendation, evidence, risk, what you’ll watch and a deadline. Build it from an activity log that records why each change was made and what it was expected to do. Limit the executive conversation to three decision points.
How can PPC data be aligned with strategic objectives for data-driven CMOs?
Translate every metric into business terms before it reaches executives. Conversion rate becomes pipeline per pound, impression share becomes demand coverage, and cost per lead becomes cost per opportunity. Metrics that can’t be connected to revenue, CAC or payback stay in the appendix rather than the summary.
What are the best practices for measuring and reporting PPC performance to stakeholders?
Keep an activity log that records the reason, expected effect and read date for every change. Judge results only after their read date, and state confidence explicitly. Use the CRM for pipeline attribution. Report a one-page summary of decisions and risks, with the full log available as an appendix.
How can CMOs present board-ready narratives that link PPC activities to revenue growth?
Lead with one business headline, then present up to three decision points and two risks. Link each to the specific changes in the activity log that produced the evidence. Show what changed in a few lines, not dozens of charts. The narrative should ask for direction, not just report activity.
What are the key risks to consider when analysing PPC activity logs?
The main risks are crediting results to the wrong change when several overlap, reading results before enough time has passed, and logging only successful changes. Others include ignoring seasonality, missing tracking outages that distort results, and presenting single numbers with more precision than the data supports.
How can CMOs balance brand positioning with performance in PPC campaigns?
Log brand and demand creation changes with the same rigour as performance changes, including realistic read dates. Judge brand decisions on brand evidence, such as branded search volume, direct demo requests and self-reported attribution. Without that discipline, precise performance metrics win every budget argument by default.
What tools can help CMOs navigate multi-stakeholder environments in PPC decision making?
The most useful tools are simple: a shared activity log that sales and finance can see, a consistent decision point template, and a standing slot in leadership meetings. Name an owner for each decision point. Shared context speeds up decisions more than any dashboard does.
How can long sales cycles impact PPC strategy and decision making?
Long sales cycles mean closed-won revenue from today’s changes won’t appear for months. Decision points should rely on leading indicators, such as opportunities created and cost per opportunity, and state when the lagging result will be known. Every log entry should have a read date that reflects the cycle.
What role does attribution play in transforming PPC data into executive decision points?
Attribution determines how confidently a result can be linked to a change. Use CRM data for pipeline attribution, and platform data to explain algorithm behaviour. Carry the confidence rating from the activity log into each decision point, so executives know how firm the evidence is before they decide.
If your PPC reporting shows plenty of activity but rarely produces a decision, the activity log is usually the place to start. Our approach to board ready reporting is built around turning that record into decisions leadership can act on, and we’re happy to talk it through.