What Boards Really Want to See from Your Paid Media Efficiency Metrics
Learn which paid media efficiency metrics boards care about—and how to report CAC, pipeline quality, and risk without drowning them in dashboards.

The quarterly board pack lands. You’ve got campaign performance slides, channel breakdowns, impression share data, quality scores. Thirty minutes into the meeting, a board member asks: “But is paid media actually working?”
It’s not a hostile question. It’s the right one. And the fact that it still catches most marketing leaders off guard says something important about how paid media gets reported.
Boards are not asking to see your dashboards. They’re asking three questions: Is growth efficient? Is it predictable? Is risk under control? If your paid media reporting doesn’t answer those three questions, it’s noise. And boards have a very low tolerance for noise.
Why Most Paid Media Reporting Fails at Board Level
The root problem is a mismatch between the metrics teams use to run campaigns and the metrics boards need to make decisions.
Click-through rates, impression share, quality scores, ad relevance, these are execution signals. They tell a campaign manager whether individual ads are performing as expected. They tell a board nothing about whether the business is acquiring customers efficiently or whether paid media spend is generating returns that justify the investment.
When marketing leaders bring execution metrics into board meetings, one of two things happens. Either the board disengages because they don’t know what to do with the data, or they probe into the numbers and create work that doesn’t move the business forward. Neither outcome is useful.
The solution is not a better dashboard. It’s a different set of metrics entirely, ones built for decision-making, not optimisation.
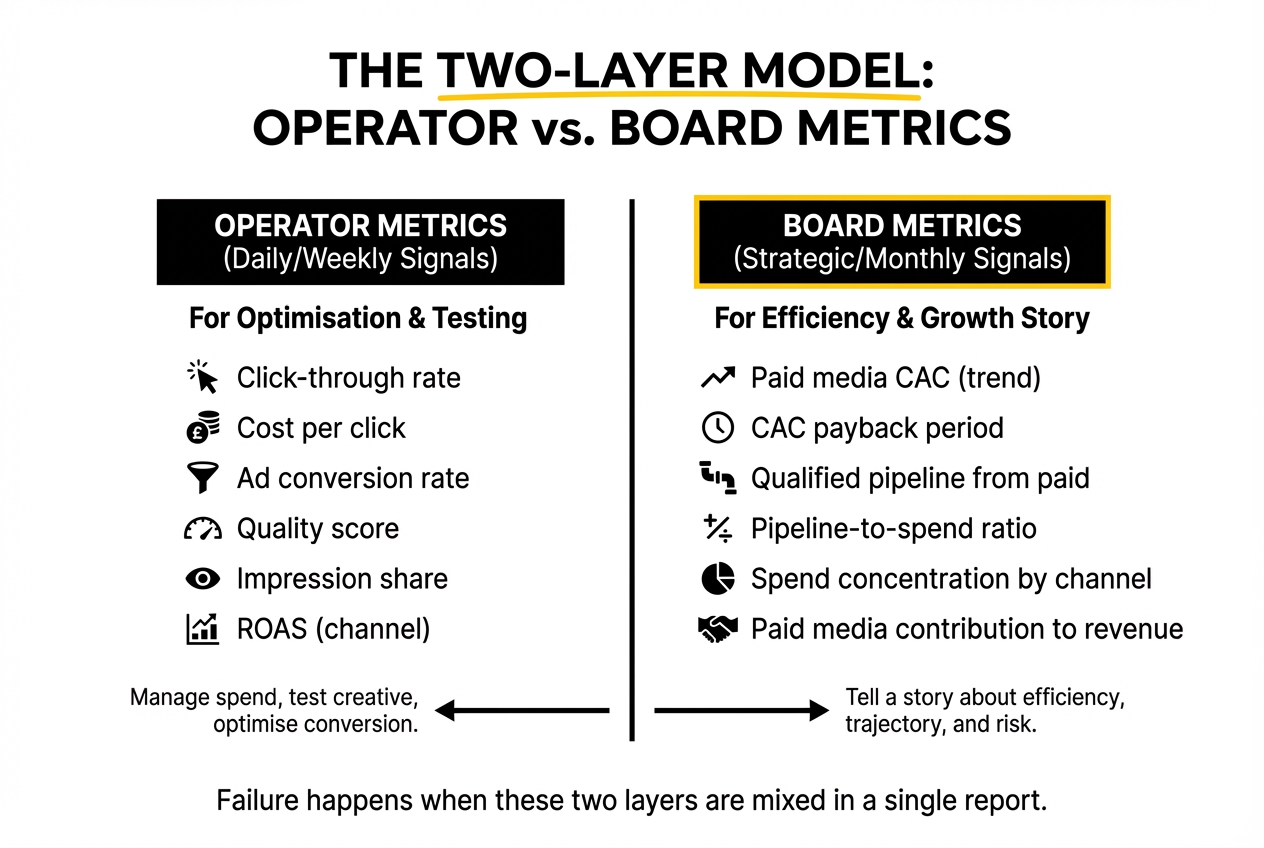
The Two-Layer Model: Operator Metrics vs Board Metrics
Think of paid media reporting as having two distinct layers.
Operator metrics are the signals your team uses daily and weekly to manage spend, test creative, and optimise toward conversion goals. These include cost-per-click, conversion rates by ad group, quality scores, and device bid adjustments. They belong in your team’s working environment, not in a board slide.
Board metrics are signals that tell a story about efficiency, trajectory, and risk. They answer the questions a board or CFO will ask. They require context and trend lines to be meaningful, and they connect directly to how the business is growing.
The table below makes the separation concrete.
Operator metric → Board metric
- Click-through rate → Paid media CAC (trend)
- Cost per click → CAC payback period
- Ad conversion rate → Qualified pipeline from paid
- Quality score → Pipeline-to-spend ratio
- Impression share → Spend concentration by channel
- ROAS (channel) → Paid media contribution to closed-won revenue
Neither layer is wrong. They serve different purposes. The failure happens when the two get mixed together in a single report and presented to a group who only needs one of them.
The Three Questions Boards Are Actually Asking
Is growth efficient?
Efficiency, in board terms, is the relationship between what you spend on paid media and what you get back in pipeline and revenue. The headline metric here is CAC, but not CAC as a raw number. A CAC of £4,000 means nothing without knowing whether it has gone up or down, how it compares to industry norms for your ACV range, and how it relates to the average contract value of the customers acquired.
CAC payback period is often more useful. It translates CAC into something boards immediately understand: how long before the business recoups its acquisition investment? According to the 2025 Benchmarkit SaaS Performance Metrics Report, the median CAC payback period across SaaS companies was 18 months in 2024. That figure varies significantly by ACV, with enterprise deals often running longer payback periods but carrying stronger long-term unit economics. Context is the difference between a number that causes panic and one that builds confidence.
The efficiency question is best answered with three data points together: current CAC, CAC trend over the last four quarters, and payback period relative to ACV. Present movement and direction, not just absolute figures.
Is it predictable?
Boards think in quarters. They’re asking whether marketing will continue to deliver pipeline at a level that supports the plan, and whether paid media is a reliable part of that system.
The metric that answers this is qualified pipeline contribution from paid. Not lead volume. Not MQL count. The number of sales-qualified opportunities that originated from paid media, and how that has trended over time.
If MQL volume is rising but sales-qualified pipeline is flat, the problem is downstream, targeting, offer quality, or ICP fit. A board slide that shows rising MQL numbers alongside flat pipeline is a story of declining quality, whether you frame it that way or not. Better to name it clearly and show what you’re doing about it than to leave a board member to draw their own conclusions.
Predictability also requires showing consistency. One strong quarter followed by a weak one is not a predictable channel. Three quarters of stable, qualified pipeline contribution from paid, even if the absolute number is modest, signals a channel under control.
Is risk under control?
This is the question boards ask least explicitly but care about most. The risk they’re evaluating is: what happens to pipeline if something breaks in paid media?
Spend concentration is the metric to watch here. If 70% of your paid media budget is running through a single channel or campaign type, a platform update, policy change, or algorithm shift can take a significant portion of pipeline with it. Boards don’t need to know the details of Google’s broad match changes. They need to know that paid media is not operating as a single point of failure.
A simple breakdown of pipeline contribution by channel, shown alongside spend concentration, gives boards the picture they need. If Google Search generates 60% of qualified pipeline on 50% of budget, that’s a relatively concentrated position. If LinkedIn generates 25% on 25% of budget and LinkedIn prospecting generates the remaining 15% on 25%, that’s a healthier distribution. Neither is inherently right or wrong, but boards should understand the structure.
Paid Media Metrics Boards Don’t Want
Unless there’s a specific problem to explain, these metrics don’t belong in a board-level paid media report.
- Keyword-level performance
- Creative test results
- Quality scores or ad relevance ratings
- Impression share by competitor
- CTR breakdowns by device or match type
These are operator-level signals. Bringing them into a board meeting without a specific reason signals that you don’t know which layer of reporting you’re in, which is a credibility issue, not just a formatting one.
The exception is when something has gone wrong. If conversion rates dropped sharply because of a platform algorithm change, a brief explanation at board level is appropriate, but still framed as context for a pipeline or CAC shift, not as a deep-dive into ad mechanics.
How to Frame Efficiency Changes Without Triggering Panic
Boards respond to unexpected changes in efficiency metrics by asking whether something has structurally broken. Your job is to give them the context that distinguishes a structural problem from expected variance.
The distinction between leading and lagging indicators is important here. CAC payback is a lagging indicator, it reflects deals that have already closed. Pipeline quality signals, MQL-to-SQL rate, pipeline-to-spend ratio, cost-per-opportunity, are leading indicators. If your leading indicators are healthy, a short-term CAC uptick is explainable. If leading indicators are also deteriorating, the CAC movement is a symptom of something deeper.
Present leading and lagging indicators together, in that order. Show the board what the early signals say, then confirm or contrast with what the lagged data shows. That framing turns a potentially alarming number into a controlled narrative.
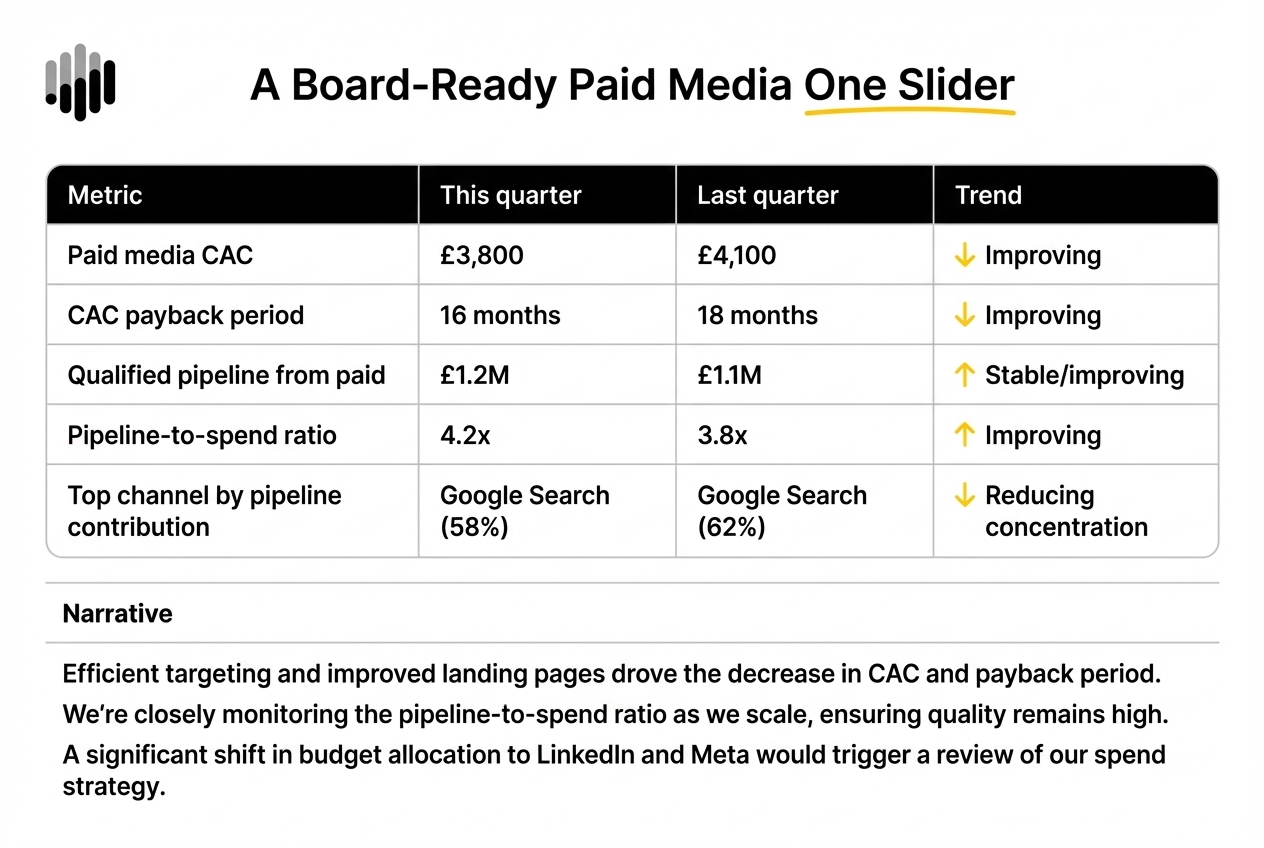
A Board-Ready Paid Media Summary
A single-page paid media summary for a board pack might look like this.
Quarterly paid media performance summary
- Paid media CAC: £3,800 (last quarter: £4,100), Improving
- CAC payback period: 16 months (last quarter: 18 months), Improving
- Qualified pipeline from paid: £1.2M (last quarter: £1.1M), Stable/improving
- Pipeline-to-spend ratio: 4.2x (last quarter: 3.8x), Improving
- Top channel by pipeline contribution: Google Search 58% (last quarter: 62%), Reducing concentration
Three sentences of narrative beneath the table: what drove the changes, what you’re watching in the next quarter, and what would cause you to adjust spend.
That is a board-ready paid media report. No dashboards. No channel breakdowns. No CTR data. Just the five signals that answer the three questions boards are actually asking. How to Build a SaaS PPC Engine for B2B SaaS (Not Just Run Ads), also on this blog, takes this further.
The Connection to SaaS Analytics Maturity
Being able to produce this kind of reporting requires something that most SaaS teams underestimate: reliable attribution from ad click to closed-won revenue. Without CRM integration that captures paid media source at the opportunity and deal level, qualified pipeline contribution is an estimate, not a number you can stand behind.
This is not a paid media problem. It’s an analytics infrastructure problem. If your SaaS analytics setup can’t connect a Google Ads click to a closed deal, you’re reporting to the board on incomplete data. You may know this. They may not.
Building the reporting infrastructure that makes board-level paid media metrics credible is as important as the metrics themselves. The SaaS analytics hub covers the measurement architecture that makes this reporting possible.
Frequently Asked Questions
What paid media efficiency metrics do SaaS boards actually care about?
Boards care about metrics that answer three questions: is growth efficient, is it predictable, and is risk under control. In practice, that means CAC trend, CAC payback period, qualified pipeline contribution from paid, pipeline-to-spend ratio, and spend concentration by channel. Execution metrics like CTR, quality score, and impression share are not board-level paid media KPIs for boards.
How should CAC be reported to the board?
CAC should always be presented with trend context, showing current quarter alongside the previous three to four quarters, and in relation to the CAC payback period and ACV range. A raw CAC figure without context is more likely to cause confusion than confidence. Show direction and compare against relevant benchmarks for your stage and ACV.
What is the difference between board-level and operator-level marketing metrics?
Operator metrics are used by campaign teams to manage day-to-day performance: CTR, cost-per-click, ad conversion rates, quality scores. Board metrics are signals that inform decisions about investment, efficiency, and risk: CAC, payback period, pipeline contribution, and spend concentration. Both matter, but they belong in different places. SaaS paid media reporting that conflates the two creates noise, not clarity.
How do you show paid media efficiency without overwhelming stakeholders?
Restrict the board report to five or fewer metrics, use a simple table format, and add three to four sentences of narrative explaining what has changed and why. Avoid attaching dashboards or detailed channel breakdowns unless specifically requested. The goal is decision-relevant clarity, not comprehensive reporting.
Which paid media metrics indicate risk to growth?
Spend concentration is the primary risk indicator. If a high proportion of paid pipeline comes from a single channel or campaign type, the business is exposed to platform risk. A declining pipeline-to-spend ratio over multiple quarters is also a risk signal, as it suggests diminishing returns from current channels.
How often should paid media performance be reported to the board?
Quarterly is appropriate for board-level paid media reporting. Monthly reporting at this level is usually unnecessary unless there is a specific efficiency concern or a material change in spend. The board’s frame of reference is the quarter and the annual plan, not the weekly campaign cycle.
What should you do when board metrics and channel metrics disagree?
This is usually a signal to investigate attribution quality, not a reason to dismiss either data set. If pipeline-to-spend ratio is improving but CAC is rising, check whether pipeline quality has shifted. More pipeline from lower-ACV deals can produce the same quantity with worse unit economics. Present both signals to the board with a hypothesis on the cause, not a selective reading of one.
If you’re rebuilding your paid media reporting structure and want a second opinion on what to show the board, this is the kind of problem we work through with SaaS teams regularly. Building a CAC reduction plan without killing growth is a natural next step if the efficiency conversation with your board has already surfaced questions about spend levels.

.png)
