Understanding the SaaS Magic Number and Sales Efficiency Ratios
Explore how marketing teams can influence the SaaS Magic Number and sales efficiency through effective PPC strategies.

Your board asks about pipeline. Your CFO points to the magic number. Your VP of Sales says the leads aren’t closing. And somewhere in the middle of that conversation, your marketing budget is at risk.
The SaaS Magic Number is one of the most cited efficiency metrics in board decks and investor conversations, yet most marketing teams engage with it only when it’s already gone red. The opportunity is to get ahead of it: to understand what the number actually measures, how marketing spend directly feeds into it, and how PPC strategies can be built and reported in ways that move it in the right direction.
This article is for CMOs and demand gen leaders who want to connect their marketing metrics and SaaS Magic Number analysis, and use that connection to make smarter budget decisions and stronger board narratives. For the full paid media context, the SaaS PPC hub covers how these efficiency metrics connect to campaign strategy.
What the SaaS Magic Number Actually Measures
The Magic Number is a sales efficiency ratio. It tells you how much new recurring revenue you generate for every dollar spent on sales and marketing in the prior period.
The standard formula using ARR:
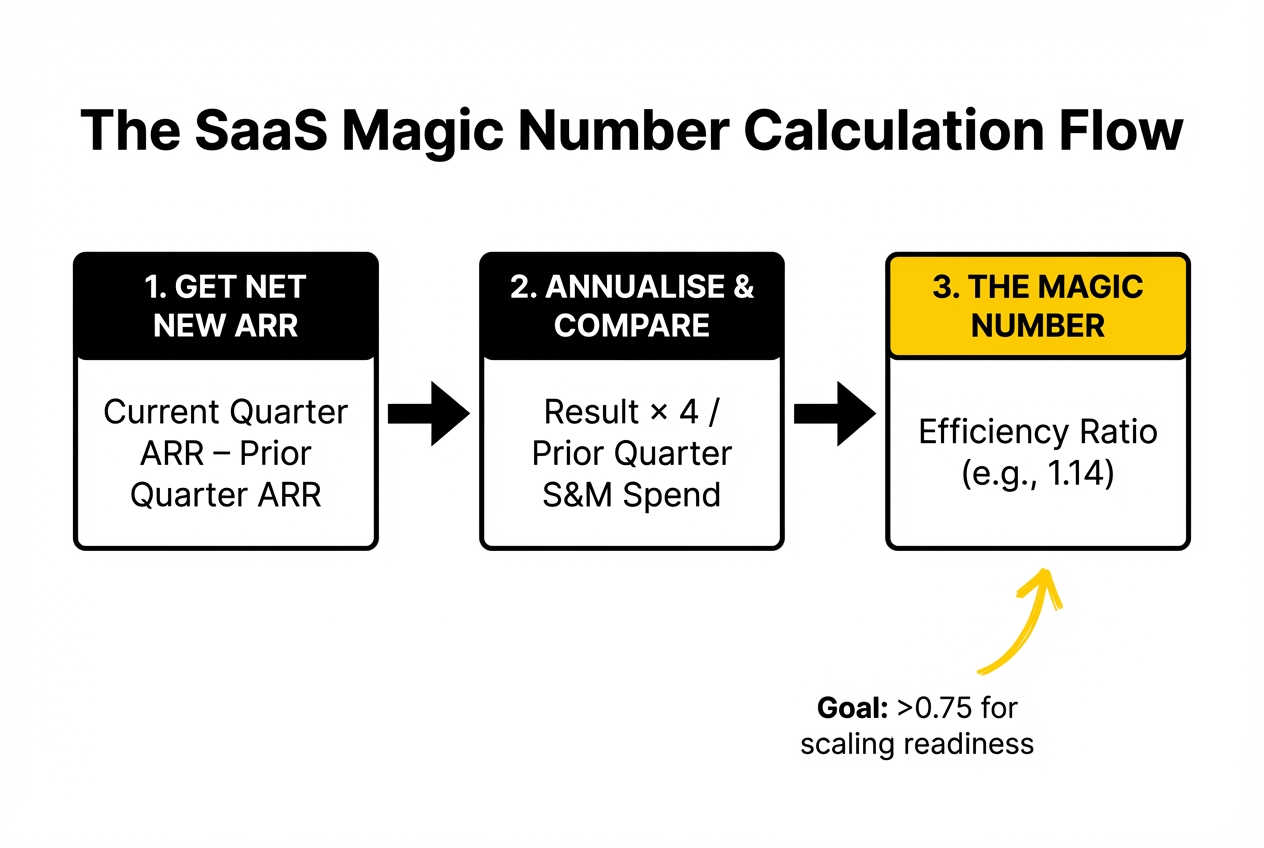
Magic Number = (Current Quarter ARR, Prior Quarter ARR) x 4 / Prior Quarter S&M Spend
If you’re working from public filings or benchmarking competitors, substitute GAAP revenue for ARR. The result won’t match precisely, but it’s close enough for comparative analysis.
A worked example: your company ends Q1 at £8M ARR and Q2 at £8.4M ARR. Q1 S&M spend was £1.4M.
Magic Number = (£8.4M, £8M) x 4 / £1.4M = £1.6M / £1.4M = 1.14
That’s a strong result. It means for every pound invested in sales and marketing, you generated more than a pound of annualised new ARR within a quarter.
The benchmark thresholds are well established. A magic number below 0.5 suggests the GTM model needs rethinking; between 0.5 and 0.75 is workable but inefficient; above 0.75 signals readiness to scale; and above 1.0 is exceptional. Scale Venture Partners’ long-term median across private SaaS companies sits around 0.7x, which is the realistic benchmark for most teams to beat, not the aspirational 1.0.
Why Marketing Teams Need to Own This Metric
The magic number lives in finance decks, but marketing spend is the denominator. That makes every inefficient pound in your PPC budget a drag on the ratio.
The problem is that most marketing teams report on the inputs: spend, clicks, CPL, MQL volume. Finance reports on the output: ARR delta. Neither team owns the connection between the two, and that gap is exactly where budget conversations get messy.
When a CMO can walk into a board meeting and explain how last quarter’s SaaS PPC strategies influenced pipeline quality, sales cycle velocity, and ultimately the magic number movement, the conversation shifts. It becomes a growth discussion rather than a cost justification.
The specific lever marketing controls is the quality and volume of new ARR entering the funnel. Expansion ARR from existing customers also feeds the numerator, which is why net sales efficiency and revenue retention deserve equal attention alongside new logo acquisition.
Net Sales Efficiency and the Expansion ARR Dimension
The standard magic number treats all net new ARR the same. Net sales efficiency goes further, incorporating expansion ARR alongside new logo revenue, and adjusting for churn.
Net Sales Efficiency = (New ARR + Expansion ARR, Churned ARR) x 4 / Prior Quarter S&M Spend
This version rewards teams running effective upsell and cross-sell motions. It also penalises teams acquiring customers who don’t stick. Benchmarkit’s 2025 data shows the median New CAC Ratio increased to $2.00 of sales and marketing spend to acquire $1.00 of new customer ARR, with bottom-quartile companies spending considerably more. For teams where net sales efficiency looks better than the raw magic number, that’s typically a signal that expansion is compensating for weak new logo efficiency. That’s worth naming clearly in board presentations rather than blending the figures.
For marketing attribution in SaaS, this matters because demand gen investments in customer marketing and lifecycle campaigns contribute to expansion ARR, not just acquisition. Those contributions should be visible in how marketing reports its impact. How to Build a SaaS PPC Engine for B2B SaaS (Not Just Run Ads), also on this blog, takes this further.
The Key Sales Efficiency Ratios to Track Alongside the Magic Number
The magic number gives a single efficiency view. It doesn’t tell you where the inefficiency lives. Pairing it with two or three supporting ratios surfaces the actual diagnostic.
CAC Payback Period measures how many months of gross margin it takes to recover the cost of acquiring a customer. A payback period above 18 months at Series B is worth investigating. Above 24 months, the unit economics are hard to defend in a fundraising conversation. See our deeper breakdown of SaaS analytics hub.
LTV:CAC Ratio captures the long-run return on acquisition spend. A 3:1 ratio is considered baseline healthy. The caution here is that LTV projections are only as reliable as your revenue retention assumptions.
Revenue Retention Rate is the often-overlooked input. A magic number that looks acceptable can mask a serious retention problem if gross logo churn is high. If you’re acquiring new ARR faster than you’re losing it, the ratio holds. If churn accelerates, the denominator problem gets worse with each quarter.
These ratios together form the diagnostic layer. The magic number tells the board where efficiency stands. The ratios tell the CMO and CFO where to look.
How PPC Strategy Directly Influences Sales Efficiency
Demand capture through PPC is the part of marketing spend most visible in a magic number calculation. Google Search and LinkedIn are material line items in most SaaS S&M budgets, which means their efficiency or inefficiency flows directly into the ratio.
There are four specific ways SaaS PPC strategies influence sales efficiency and marketing performance:
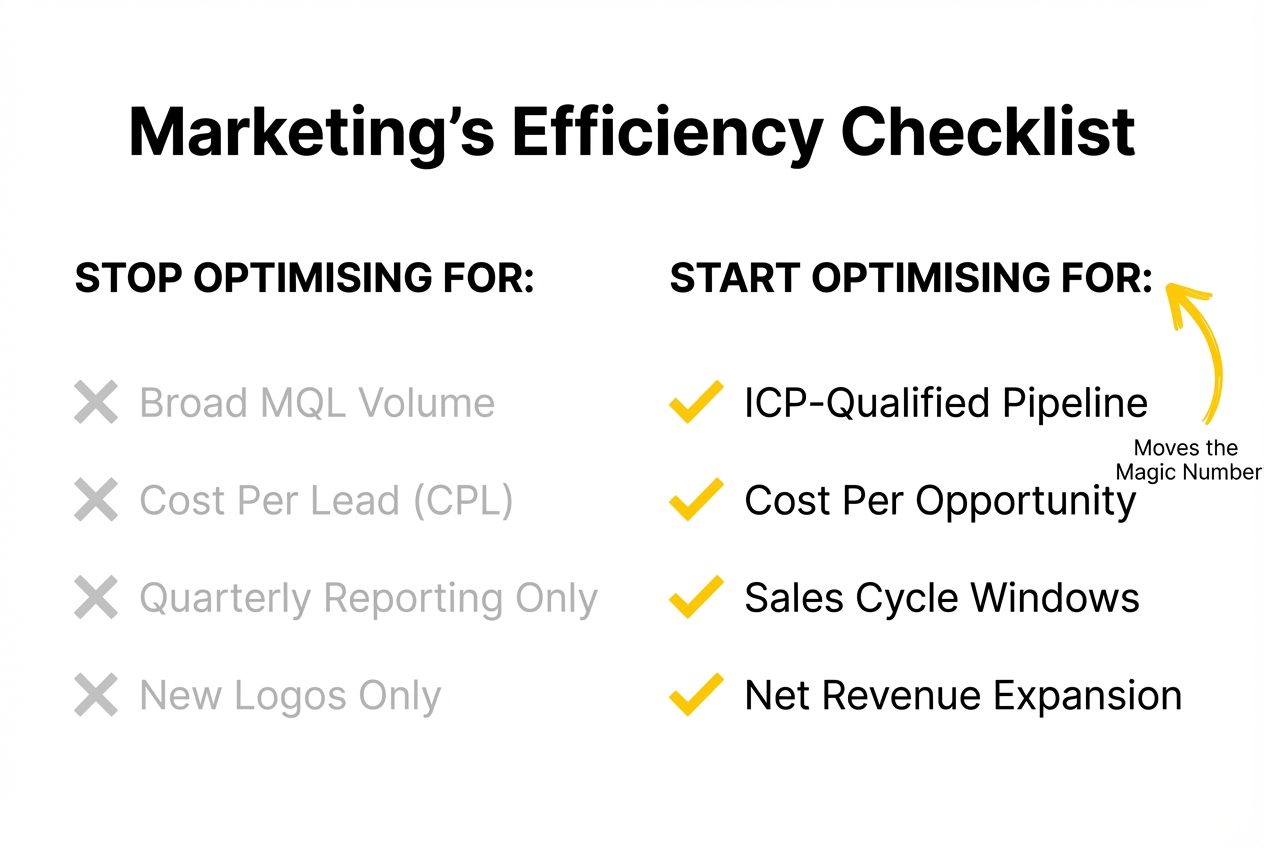
- ICP precision at the keyword and audience level. Broad targeting generates MQL volume at low cost but degrades MQL-to-SQL conversion rates. If your mid-market ICP converts at 35% from demo request to qualified opportunity but your blended PPC funnel converts at 12%, the gap is almost certainly an ICP targeting problem, not a sales problem. Tightening audience definitions, adding negative keyword lists, and filtering by company size signals reduces raw volume but improves the quality of what enters the pipeline.
- Bidding for pipeline, not leads. Most PPC accounts optimise for lead volume or cost per lead. The better signal is cost per pipeline opportunity, and better still, cost per closed-won. This requires offline conversion imports from the CRM, but it’s the only way to connect PPC in digital marketing to the financial metrics the CFO cares about. Once that data feed exists, budget allocation decisions can be made on pipeline efficiency rather than platform-reported CPL.
- Alignment between sales cycle length and measurement windows. The quarter-over-quarter structure of the magic number assumes relatively short sales cycles. For enterprise motions with 6 to 12 month average deal lengths, a trailing 12-month comparison is far more meaningful than quarter-on-quarter. The same logic applies to PPC reporting. If your average enterprise sales cycle is nine months, a PPC campaign running in Q1 won’t show up in the magic number until Q3 or Q4. Reporting on it as underperforming in Q1 or Q2 is a measurement error, not a performance signal.
- Expansion targeting to protect net sales efficiency. Retargeting campaigns to existing customer personas, LinkedIn campaigns targeting contacts at existing accounts, and competitor conquest campaigns aimed at adjacent buyer personas within accounts all contribute to expansion ARR. These are not traditional new logo PPC plays, but for teams managing a blended magic number, they deserve budget allocation and separate attribution.
Navigating Attribution in Long SaaS Sales Cycles
Attribution is where the strongest case for marketing’s contribution to sales efficiency also gets the hardest to make. B2B SaaS deals involve multiple stakeholders, multiple touchpoints across weeks or months, and a last-click model that systematically undervalues awareness and mid-funnel investment.
The practical approach is not to solve attribution perfectly. It’s to agree on a consistent model and measure it the same way every quarter. Directional consistency matters more than methodological precision. Marketing attribution in SaaS works well enough when the same model runs long enough to produce trend data.
For CMOs reporting to boards, the most useful framing is influence attribution alongside conversion attribution. Conversion attribution answers “which channel drove the form fill.” Influence attribution answers “which channels appeared in the buying journey for closed-won deals.” The second question is more useful for budget decisions. Building a sales feedback loop between your SDR team and PPC campaigns is the operational mechanism that keeps this data current.
.jpeg)
Balancing Brand and Performance in Budget Decisions
The magic number creates pressure toward short-cycle demand capture, because capture spend produces signals faster. Brand and demand gen investment takes longer to show up in ARR, which makes it harder to defend in efficiency-focused conversations.
The CMO’s job is to hold both cases simultaneously. A magic number declining from 0.9 to 0.6 over three quarters is not automatically a case for cutting brand spend. It may be a case for investigating churn, examining deal size compression, or questioning whether the ICP has shifted. Cutting the brand budget to improve a quarter’s number can erode pipeline health six months later.
The stronger board narrative is not “we spent less and the number improved.” It is “we understand what drives this number and here is the specific set of marketing decisions we made to move it.”
Using Industry Benchmarks to Frame Budget Decisions
Benchmarks give the CMO a credible external reference point. The magic number thresholds established by Scale Venture Partners, the Benchmarkit data on CAC ratios, and ChartMogul’s annual growth cohort analysis all give context that internal metrics alone cannot provide.
The right use of benchmarks in board discussions is to frame position, not excuse performance. “Our magic number sits at 0.68 against a private SaaS median of 0.7, with Q2 S&M investment weighted toward a product launch campaign that has a longer attribution lag” is a different conversation from “0.68 is fine because the benchmark is 0.75.”
For budget decisions for SaaS marketing, the benchmark question is: at our current magic number and growth stage, are we in a position to increase S&M investment and expect a proportional return? That’s the actual decision the board wants to make, and the CMO is best placed to answer it with pipeline quality data, not just spend data.
Frequently Asked Questions
What is the SaaS Magic Number and why is it important for marketing teams?
The SaaS Magic Number measures how efficiently a company converts sales and marketing spend into new recurring revenue. It’s calculated by taking the quarterly ARR increase, annualising it, and dividing by the prior quarter’s S&M spend. Marketing teams need to own it because their budget is the largest variable in the denominator. A magic number above 0.75 signals readiness to scale; below 0.5 suggests the GTM model needs review before increasing investment.
How can marketing teams influence the SaaS Magic Number through PPC strategies?
The primary lever is lead quality, not volume. Tighter ICP targeting in PPC campaigns reduces MQL volume but improves MQL-to-SQL conversion, which raises pipeline efficiency and lowers effective CAC. Connecting PPC platforms to CRM pipeline data via offline conversion imports allows spend allocation based on cost per closed-won rather than cost per lead, directly improving the efficiency ratio.
What are the key sales efficiency ratios that SaaS companies should track?
The core set is the Magic Number, CAC Payback Period, LTV:CAC ratio, and Net Revenue Retention. Together they answer the four critical GTM questions: how efficiently are you converting S&M spend (magic number); how long until acquisition costs are recovered (payback period); what’s the long-run return on each acquired customer (LTV:CAC); and are you retaining and growing existing revenue (NRR).
How does attribution work in lengthy sales cycles for SaaS companies?
Single-touch models systematically undervalue brand and mid-funnel investment when sales cycles run six months or longer. The practical approach is to adopt a consistent multi-touch attribution model and report directionally over time rather than seeking precision. Complement conversion attribution with influence attribution on closed-won deals to build a fuller picture of which channels contributed to pipeline, not just which channel got the last click.
What are the best practices for aligning marketing efforts with financial outcomes in SaaS?
Report on cost per qualified opportunity and cost per closed-won, not just CPL. Build CRM-to-platform data flows that allow PPC platforms to optimise toward downstream revenue signals. Set measurement windows that match your average sales cycle length rather than defaulting to the calendar quarter. And agree on a shared MQL and SQL definition with sales so conversion rate data is comparable over time.
How can CMOs articulate the impact of marketing on sales efficiency to their boards?
Frame the narrative around pipeline quality and efficiency trend, not spend and volume. Present the magic number in context: where it sits relative to SaaS benchmarks, what drove any quarter-on-quarter movement, and what specific marketing decisions are expected to move it in the next two quarters. The goal is to present marketing as the part of the business that understands pipeline economics, not the part that manages the ad budget.
What challenges do SaaS companies face in measuring marketing effectiveness?
The three primary challenges are attribution complexity in multi-stakeholder buying journeys, measurement window mismatch between long sales cycles and quarterly reporting, and the difficulty of separating marketing’s contribution to expansion ARR from customer success and product-led signals. Each has a workable approach, but none has a perfect solution. Consistent methodology over time matters more than methodological precision at any one point.
How can marketing teams balance brand positioning with performance pressures?
Treat them as different investment horizons, not competing priorities. Performance spend produces signals in weeks. Brand and demand gen investment produces pipeline impact in quarters. Cutting brand spend to improve a short-term magic number can create a pipeline gap that takes two or three quarters to show up. The CMO’s job is to make that dynamic visible to the board, not manage against it silently.
What role do measurable outcomes play in SaaS marketing strategies?
They shift marketing from a cost centre to a growth function. When marketing can show cost per pipeline opportunity, MQL-to-SQL conversion by channel, and attribution contribution to closed-won ARR, budget decisions become investment decisions. The data-driven SaaS CMO who can connect paid media spend to the magic number movement has a fundamentally different board conversation than one who reports on impressions and click volume.
How can CMOs use industry benchmarks to inform budget decisions?
Use them to frame position, not justify performance. Benchmarkit’s 2025 SaaS data, Scale VP’s magic number thresholds, and ChartMogul’s growth cohort benchmarks all give credible external context. The right question is not “are we above median” but “given where we sit relative to benchmarks and our current growth stage, is increasing S&M investment likely to produce an improving magic number or a declining one?”
If you’re working through how to connect your PPC metrics to board-level efficiency reporting, this is something we work through with SaaS teams regularly. Worth a conversation if you’re at that stage.