Crafting Effective Monthly Paid Media Reports for SaaS Success
How to structure monthly SaaS paid media reports around pipeline, explain variance without the noise, and rank recommendations by revenue impact so the report drives decisions.

The monthly paid media report arrives on time. It’s thorough, well formatted and full of charts. It gets twenty minutes in the leadership meeting, a few nods, and then nothing changes. Next month, the same report arrives again.
That’s the most common failure in SaaS paid media reporting. The data is right, but the report doesn’t lead anywhere. Effective monthly SaaS paid media reports do something different. They connect last month’s spend to pipeline, explain what moved and why, and end with a short list of ranked recommendations that someone actually has to act on.
This article sets out how to build that kind of report. It covers the structure to use, the key metrics for SaaS paid media analysis, how to explain variance, and a simple framework for prioritising recommendations by revenue impact. It also covers how to handle attribution and present the report to different stakeholders.
What a Good Monthly Paid Media Report Is
A good monthly SaaS paid media report is a recurring document that connects the month’s paid media spend to pipeline and revenue. It explains the variance against plan and ends with ranked recommendations, each with an owner, an expected impact and a budget implication.
The definition rules out a lot of what usually fills these reports. Click-through rates, impression counts and platform-reported conversions can all appear, but only as diagnostics in the appendix. The core of the report is about understanding revenue: what paid media produced, what it cost, and what should change next month.
The goal is dynamic engagement: a report people discuss, challenge and act on, rather than one they skim and file.
The Report Structure: A Monthly Template
Most monthly SaaS paid media report templates are organised by channel. That puts the detail first and the conclusions last. Organise by question instead, in this order:
- Headline and verdict: one sentence on whether paid media is on track against plan, and why.
- Pipeline and revenue scorecard: the outcome metrics against plan, last month and the same month last year.
- Variance explained: what drove the biggest movements, broken down into causes.
- Changes and tests: what was changed during the month, and what the results show so far.
- Ranked recommendations: three to five actions, prioritised by revenue impact.
- Risks and watch-list: what could affect next month, and the leading indicators to watch.
- Appendix: channel and campaign detail, diagnostics and the full change log.
A VP of Marketing should be able to read the first page and know what to approve. Everything after the recommendations is supporting evidence.
Key Metrics for SaaS Paid Media Analysis
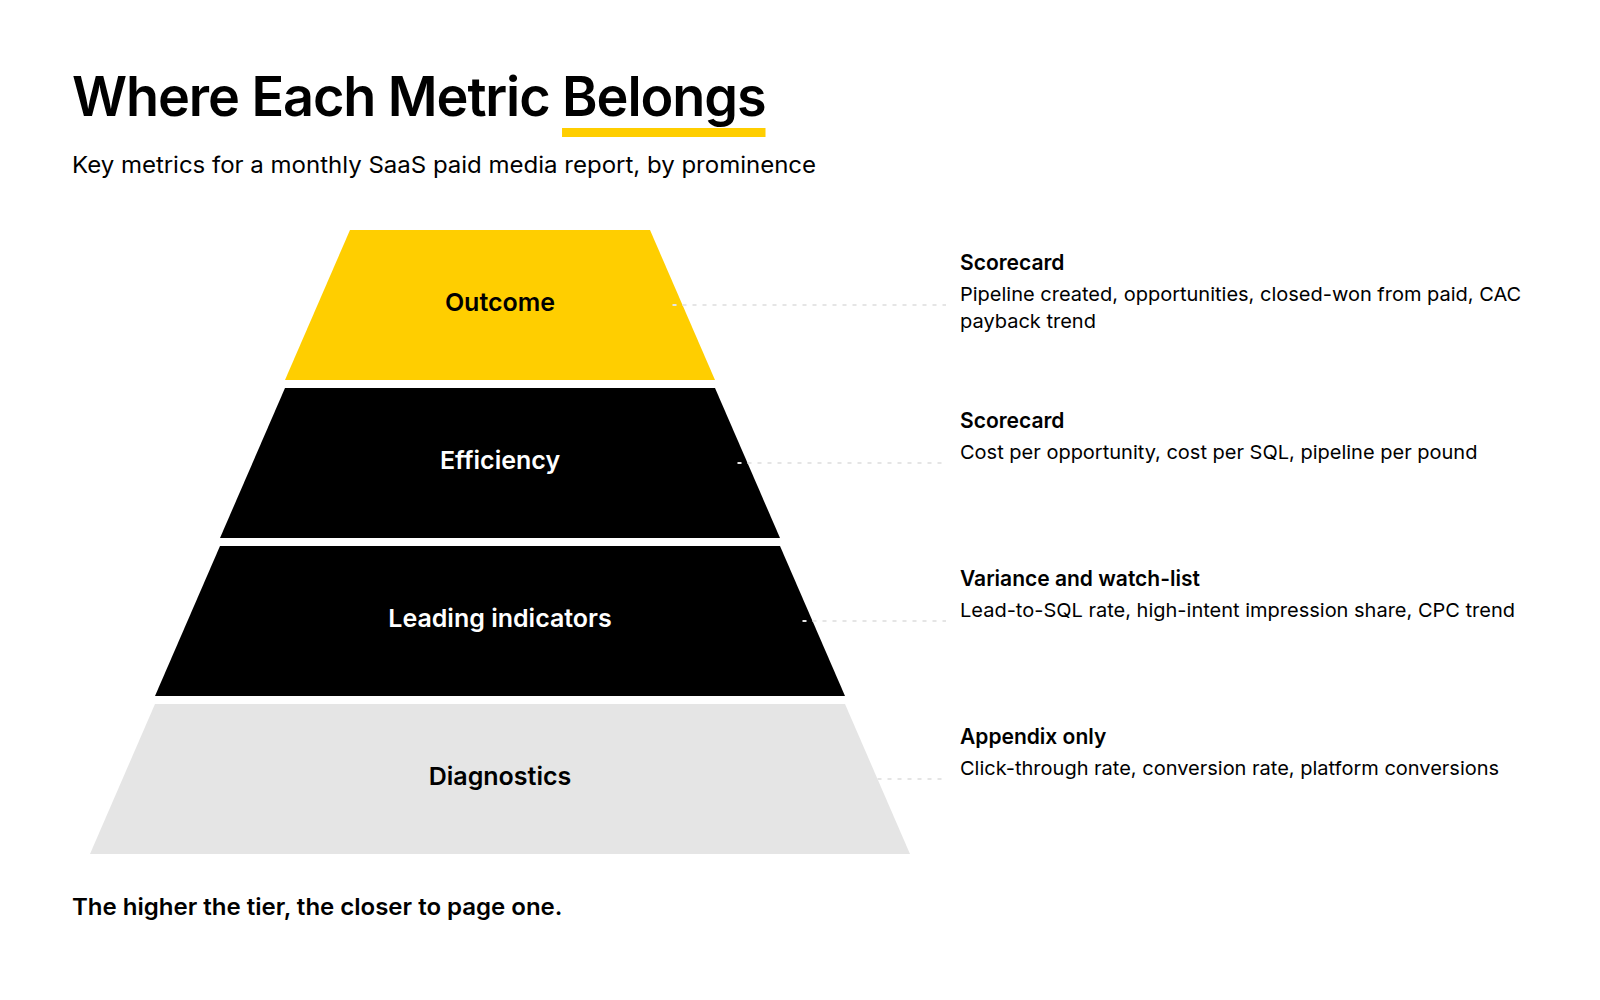
Not every metric deserves the same prominence. Group them into four tiers, and give each tier its place in the report:
- Outcome metrics (scorecard): pipeline created from paid media, opportunities created, closed-won revenue from paid, and the trend in CAC payback.
- Efficiency metrics (scorecard): cost per opportunity, cost per sales-qualified lead and pipeline generated per pound spent.
- Leading indicators (variance and watch-list): lead-to-SQL rate, impression share on high-intent terms and cost per click trends.
- Diagnostics (appendix only): click-through rate, conversion rate and platform-reported conversions.
Long B2B sales cycles complicate the outcome tier. Closed-won revenue from last month’s spend won’t appear for several months. Show it as a cohort view, tracking each month’s spend against the pipeline and revenue it eventually produced, rather than as a single monthly number. That way, the report shows spend maturing over time instead of a misleading monthly snapshot.
Explaining Variance Without the Noise
Monthly numbers are noisy. A report that reacts to every swing produces recommendations that reverse themselves within a quarter. Two habits keep variance analysis useful.
First, compare against three baselines: plan, the trailing three-month average and the same month last year. A movement that shows up against all three is real. One that only appears month on month is usually noise.
Second, break efficiency changes into their components. Cost per opportunity is cost per click divided by the click-to-lead rate and the lead-to-opportunity rate. When it moves, show which component moved.
Consider an illustrative month where cost per opportunity rose by 25%. The breakdown shows cost per click up 10%, click-to-lead rate flat and lead-to-opportunity rate down 12%. Together, those produce the 25% rise. The headline problem looks like media cost, but more than half of it comes from downstream lead quality. That points the recommendation at targeting and sales feedback, not bids.
Recommendations That Matter: A Prioritisation Framework
Recommendations are where most monthly reports either earn their place or don’t. The common failure is a long, unranked list of things that could be done. Fifteen suggestions with equal weight is effectively no recommendation at all.
Give every recommendation the same six fields:
- Action: what should change, in one sentence.
- Expected impact: the likely effect on opportunities or pipeline, as a range.
- Confidence: high, medium or low, based on the strength of the evidence.
- Effort and cost: what it takes to do it, including any budget change.
- Reversibility: how easily it can be undone if it doesn’t work.
- Owner: who needs to act or approve.
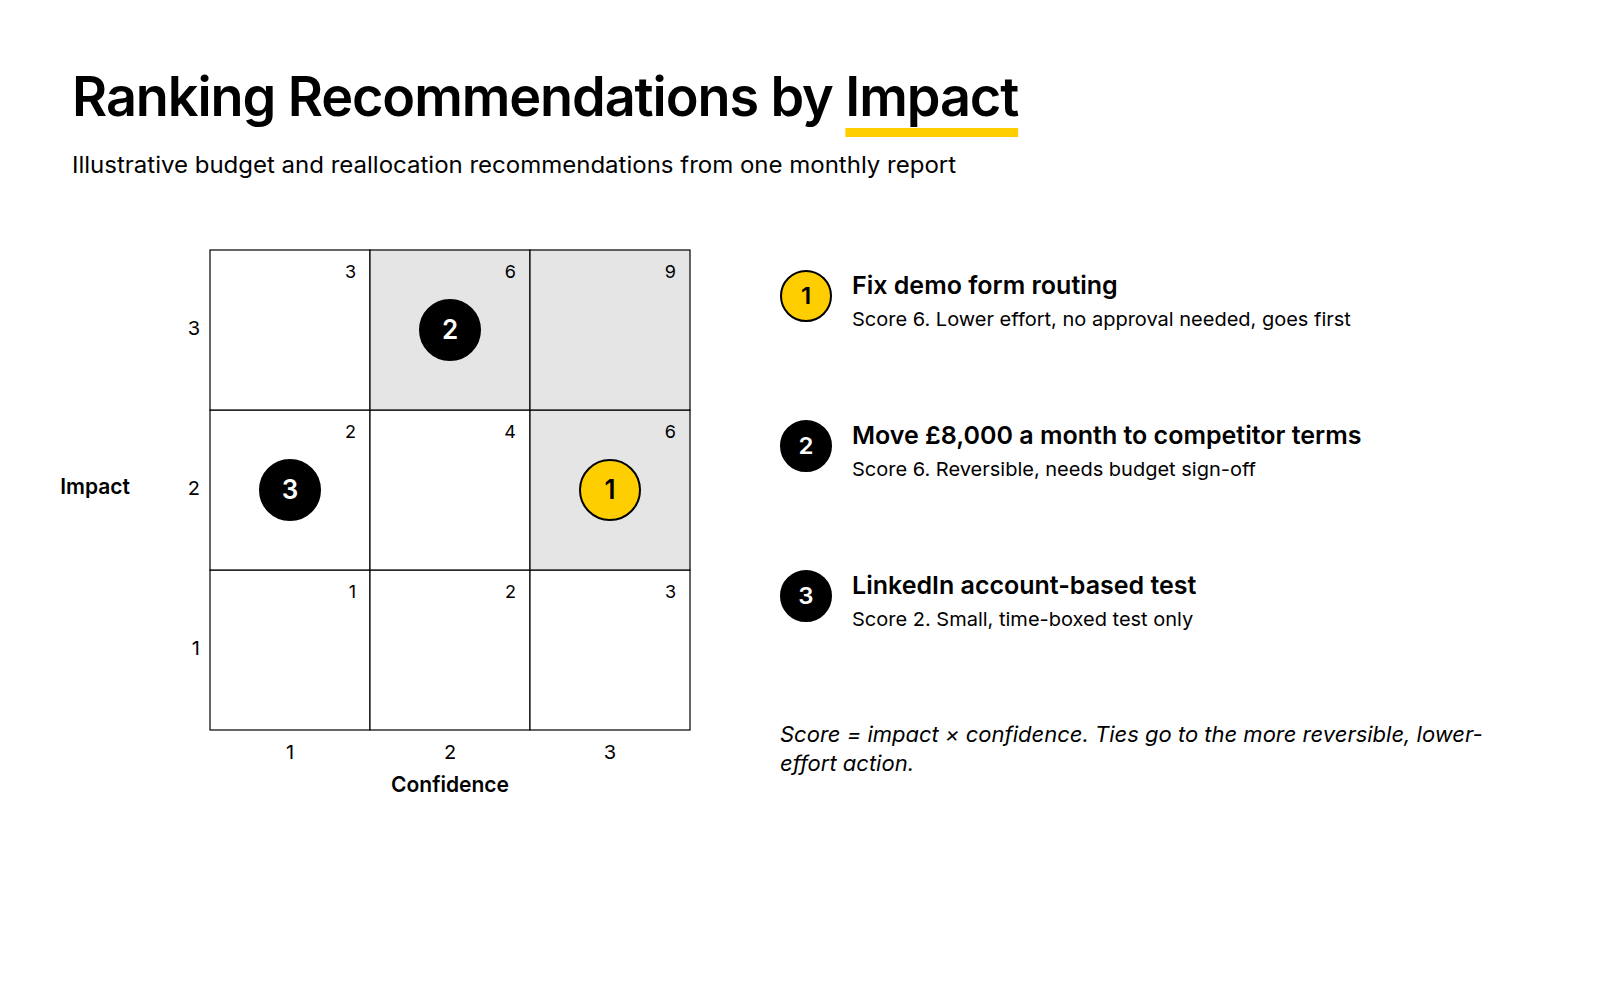
Then rank. Score impact and confidence from one to three each and multiply them. Where two recommendations tie, put the more reversible, lower-effort one first. Bring three to five recommendations at most. The rest go in a backlog.
Consider three illustrative recommendations from the same month:
- Fix demo form routing so ICP-fit leads reach sales within an hour. Impact 2, confidence 3: a score of 6. Low effort and fully reversible.
- Move £8,000 a month from generic non-brand terms to competitor terms. Impact 3, confidence 2: a score of 6. Reversible, but needs budget sign-off.
- Launch a LinkedIn account-based test for enterprise accounts. Impact 2, confidence 1: a score of 2. Recommended as a small, time-boxed test rather than a full programme.
The first two tie on score. Form routing goes first because it’s lower effort and needs no approval. The ranking itself tells stakeholders where attention should go. For what each recommendation should contain in more depth, see Essential Elements of Effective Monthly SaaS PPC Recommendations.
Justifying Budget Recommendations
Budget recommendations face the most scrutiny, and they need the strongest evidence. An effective budget case in a monthly report has three parts.
First, it uses marginal cost per opportunity, not the average. The next £10,000 in a channel rarely performs like the last £10,000, especially in search, where high-intent demand is finite.
Second, it translates the change into payback. A recommendation that moves cost per opportunity should say what that means for CAC payback, because that’s the number finance will judge it on.
Third, it shows the cost of not acting. “If we don’t fund this, we expect to lose X opportunities next quarter” is a far stronger case than “this channel is performing well”. For the framework behind payback-based budget splits, see Aligning Paid Media Budget with CAC Payback Targets in SaaS.
Multi-Touch Attribution in a Monthly Report
Multi-touch attribution marketing promises a complete picture of the B2B journey. In practice, different models give different answers, and a monthly report that switches between them loses credibility quickly.
Three rules keep attribution useful in a monthly cadence. Report two consistent lenses side by side: CRM-sourced pipeline as the conservative view, and data-driven attribution from the ad platform or analytics tool as the broader view. Don’t change models or attribution windows mid-quarter, because quarter-over-quarter comparisons depend on consistency. And when assumptions do change, log the change in the report’s appendix with the reason and the date.
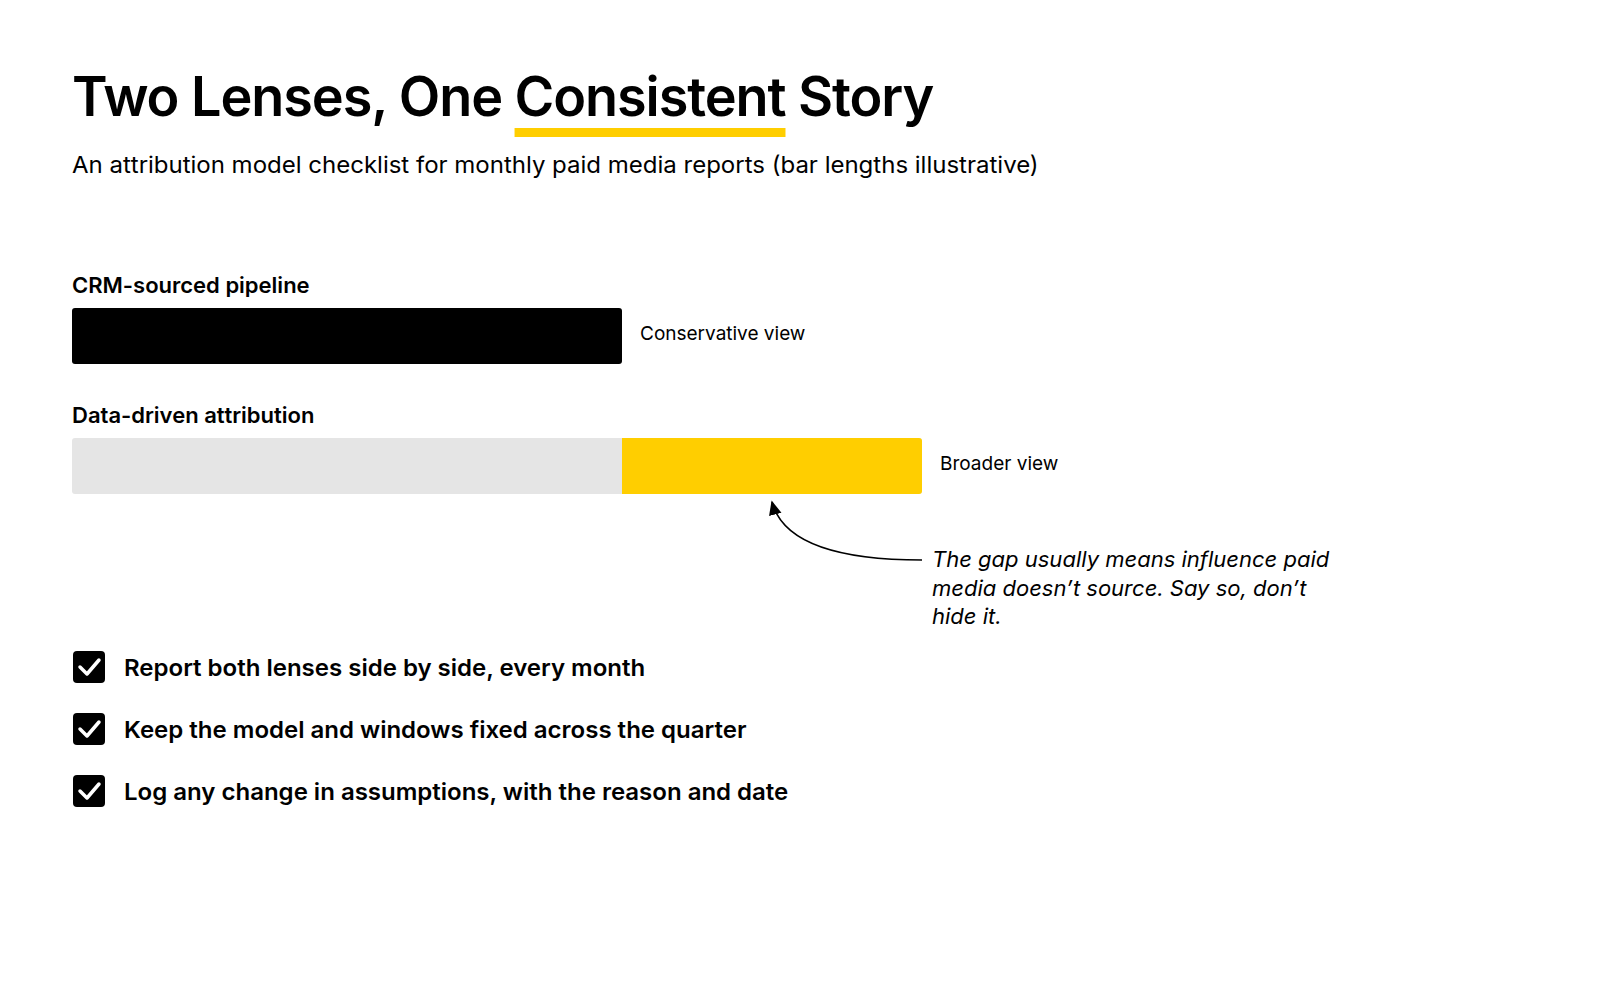
Where the two lenses disagree, say so. A gap between CRM-sourced and data-driven figures usually means paid media influences deals it doesn’t source. That’s useful context for budget decisions, not a problem to hide. For setting up attribution that holds up under board scrutiny, see Mastering Board-Defensible SaaS Attribution for Long Buying Journeys.
Keeping the Quarter-on-Quarter View in Sight
VPs of Marketing are judged on quarter-over-quarter growth, but monthly reports often lose sight of it. Add a rolling view to the scorecard: pipeline from paid media for the quarter to date against the quarterly plan, and the same point last quarter.
This stops a strong or weak month from being read in isolation. It also gives the recommendations a clear frame. Each one should say whether it protects this quarter’s number or builds next quarter’s.
Communicating Value to Stakeholders
One report goes to several stakeholders, and each reads it differently. Design for three reading paths:
- Leadership and the board: the headline, scorecard and ranked recommendations on page one.
- Sales: opportunity quality, lead-to-SQL rates and the sales feedback behind any targeting changes.
- Finance: spend against plan, cost per opportunity and the payback implications of budget recommendations.
Each stakeholder should find their answer without reading the whole report. For reporting that goes to the board rather than the leadership team, see Essential Guide to Board-Ready PPC Reporting for SaaS. For turning performance into executive decisions, see Transforming PPC Performance into Strategic Decisions for SaaS.
Tools for Monthly SaaS Paid Media Reporting
The tooling can be simple. Most SaaS teams need three components: the CRM for pipeline and revenue, the ad platforms for spend and diagnostics, and a reporting layer that joins them. That might be a BI tool or a spreadsheet with automated data pulls.
Automate the data, not the commentary. Pulling numbers into the scorecard should take minutes. Writing the variance explanation and the ranked recommendations should take the time, because that’s where the value is. For automating the data layer, see Enhancing SaaS PPC Reporting with Automated Dashboards. For the wider approach, see our saas analytics services.
Common Mistakes to Avoid
These are the mistakes that most often stop monthly reports from driving decisions:
- Leading with channel detail. Conclusions buried on slide twelve don’t get read.
- Reporting platform conversions as outcomes. They measure customer behaviour on the site, not pipeline.
- Unranked recommendation lists. Fifteen equal suggestions produce zero decisions.
- Reacting to single-month swings. Compare against plan, trailing average and last year before recommending a change.
- Switching attribution models. Consistency matters more than precision for month-to-month trends.
- No owner on recommendations. A recommendation without an owner is an observation.
Frequently Asked Questions
What key metrics should be included in a monthly SaaS paid media report?
Lead with outcome metrics: pipeline created, opportunities, closed-won revenue from paid and the CAC payback trend. Add efficiency metrics such as cost per opportunity and pipeline per pound. Include leading indicators like lead-to-SQL rate and impression share on high-intent terms. Keep click-through rate and platform conversions in the appendix as diagnostics.
How can you structure a paid media report to provide actionable insights?
Organise by question rather than by channel. Start with a headline verdict, then a pipeline scorecard, variance explained, changes and tests, and ranked recommendations. Finish with risks and an appendix of channel detail. A senior reader should know what to approve from the first page alone.
What recommendations can help justify budget allocations for paid media?
The strongest budget recommendations use marginal cost per opportunity rather than averages. They translate the change into CAC payback and show the cost of not acting. Each should include an expected impact range, a confidence level and an owner, so finance can weigh it against other uses of the budget.
How can you integrate paid search performance with broader revenue strategies?
Report paid search in pipeline and revenue terms rather than clicks and conversions. Track monthly spend cohorts against the pipeline and revenue they produce, and include a rolling quarter-to-date view against the revenue plan. Each recommendation should state whether it protects this quarter’s number or builds next quarter’s.
What are the best practices for demonstrating ROI in paid media reports?
Use CRM data for pipeline and revenue, and show it as cohorts to account for long sales cycles. Translate efficiency into CAC payback. Present two attribution lenses consistently, and explain gaps rather than hiding them. Avoid presenting platform-reported conversions as evidence of return.
How can multi-touch attribution methodologies enhance paid media reporting?
Multi-touch attribution shows influence that last-touch and CRM-sourced views miss, especially in long B2B journeys. Use it alongside CRM-sourced pipeline, not instead of it, and keep the model consistent across the quarter. Log any change in assumptions so quarter-on-quarter comparisons stay valid.
What common pitfalls should be avoided when creating monthly paid media reports?
The most common are leading with channel detail, treating platform conversions as outcomes, and listing recommendations without ranking them. Others include reacting to single-month swings, switching attribution models mid-quarter, and leaving recommendations without a named owner.
How often should you evaluate and adjust your paid media strategy?
Review performance monthly and make small, reversible adjustments, such as fixing routing or pruning search terms. Make larger budget reallocations quarterly, once enough data has matured to judge them. Compare against plan, trailing averages and last year before acting, so adjustments respond to real trends rather than monthly noise.
What tools can assist in creating effective paid media reports for SaaS companies?
Most teams need the CRM for pipeline and revenue, the ad platforms for spend, and a reporting layer such as a BI tool or an automated spreadsheet to join them. Automate the data collection so the time goes into explaining variance and writing recommendations, which is where reports add value.
How can you effectively communicate the value of paid media efforts to stakeholders?
Design the report for three reading paths. Leadership needs the headline, scorecard and recommendations. Sales needs opportunity quality and the feedback behind targeting changes. Finance needs spend against plan and payback implications. Each stakeholder should find their answer on the first page or two.
If your monthly paid media report arrives on time but rarely changes anything, the structure is usually the problem, not the data. This is the kind of reporting we build with SaaS revenue teams, and we’re happy to look at yours. Agency-level board reporting is covered in more depth in Board-Level Reporting Agencies for SaaS Growth Teams.